


Visor: Real-time Log Monitor - Read The Docs
Web page: https://xuwenyihust.github.io/Visor/
Visor is a real-time log monitor that supports different log patterns, currently Apache access log format and Apache error log format.
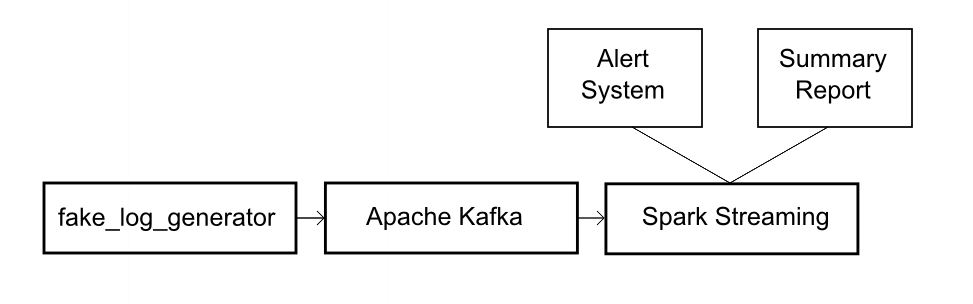
Visor can monitor multiple log sources at the same time, and in realtime with the help of Apache Kafka and Spark Streaming.
This can be a simple and relative complete example of real-time log monitor, if you have a lot of continously generated logs to be analyzed, or you want to learn how to build a log monitor, Visor can be a good choice.
Also, if you want to see how Visor works, or have your own monitor to test, but you don't have access to real logs, Visor has its own fake log generator to generate likely log files for analytics.
The Visor's documentation is hosted on GitBook at https://xuwenyihust.gitbooks.io/visor-real-time-log-monitor/content/.
Visor is designed to be highly modular. Easly to be configured, and extended if you want.
The whole platform is composed of several components:
- Fake log generator
- Log import system
- Log analysis system
- Alerting system
- Output Storage
- Dashboard
The generated log lines will be stored into files by default, you can also stream them into the analysis part through TCP sockets or Apache Kafka.
Currently we support generating and analyzing 2 log formats: Apache access log format and Apache error log format.
| Access Log Fields | Error Log Fields |
|---|---|
| IP address of the client | Date and time |
| RFC 1413 identity of the client | Message level |
| UserID of the client | Process ID |
| The time that the request was received | Client Address |
| Request line from the client | Detailed error message |
| HTTP status code | N/A |
| Size of the object returned to the client | N/A |
In real world, log traffic may have huge peaks, and these peaks may lead to high latencies in our streaming system.
So the generator supports suddenly producing huge amounts of logs in a short time to try to give the streaming system more pressures.
-
Log import rates shown by Spark UI: (with backpressure off)


The generator supports controlling the log fields contents, such as HTTP status code in access logs and client address in error logs.
-
Client address distribution: (binomial distribution)
Initialize a pool of client addresses, then generate the index to the pool applying binomial distribution every time to select address for a error log line.


Support 3 log import modes:
- Direct file import
- TCP socket transmission
- Apache Kafka streaming
The platform also provides 3 different analysis application:
- Mini-monitor
- Spark-monitor
The mini-monitor is a simple prototype, written in pure Python. It can only work with the direct file import method, and write the analysis results into a file.
The application implemented with Spark Streaming can realize real-time when used with Apache Kafka.
-
Can detect & announce errors with very short latency through email.
-
Will be generated every interval (configured by users), to report informations including total # of errors in the last report interval, error rate, top ip addresses etc.


Kafka + Spark Streaming:
Add the application's root directory to both $PYTHONPATH and $VISORHOME.
Use JSON for configuration files, all stored under $HOME/config.
An example of the configuration files:
{
    "heartbeat" : {
        "interval": "3",
        "message": "HEARBEAT"
    },
    "warn": {
        "interval": {
            "min": 5,
            "max": 30
            },
        "message": [
            "Have no idea what the professor is talking about",
            "My phone is out of battery",
            "Forgot to bring my wallet with me",
            "Do not play overwatch"
        ]
}A new json file needs to be created by user to store the authentication information of the Alert / Report system sender email.
The format should be like:
{
	"email": {
		"address": "XXXXXXXXXXXXX",
		"password": "XXXXXXXXXXXXX"
	}
}
And named after 'private.json'.
- Run fake log generator:
python3.4 $VISORHOME/src/fake_log_gen/fake_log_gen.py -m [access/error] -o [logfile]
- Run Mini-Monitor to analyze generated log files:
python3.4 $VISORHOME/src/mini_monitor/mini_monitor.py -i [logfile]
- Generate fake logs and run as TCP server:
python3.4 $VISORHOME/src/socket/fake_log_stream.py -m [access/error]
- Run Spark Streaming application to receive & analyze logs
$SPARK_HOME/bin/spark-submit $VISORHOME/src/stream_monitor/stream_monitor.py
- Start a Kafka server:
$KAFKA_HOME/bin/kafka-server-start.sh $KAFKA_HOME/config/server.properties
- Create a Kafka topic:
$KAFKA_HOME/bin/kafka-topics.sh --create --zookeeper localhost:2181 --replication-factor 1 --partitions 1 --topic Logs
- Check if the topic has been created:
$KAFKA_HOME/bin/kafka-topics.sh --list --zookeeper localhost:2181
>>> Output:

...
Logs
...
- Generate fake logs and run as Kafka producer:
python3.4 $VISORHOME/src/fake_log_gen/fake_log_producer.py -m [access/error] -o $VISORHOME/log/fake_log_producer.log
- Run Spark Streaming application to consume & analyze logs
$SPARK_HOME/bin/spark-submit --packages org.apache.spark:spark-streaming-kafka-0-8_2.11:2.0.0 $VISORHOME/src/kafka_monitor/kafka_monitor.py > $VISORHOME/log/kafka_monitor.log
Check the Visor's Wiki to see the test environment.
| Spec | Stat |
|---|---|
| Batch Interval | 2.5 Sec |
| # of Executors | 1 |
| # of Cores per Executor | 4 |
| # of Kafka Topic Partition | 1 |
| Avg Input Rate | 41.76 Rec/Sec |
| Avg Processing Time | 1 Sec 982ms |
-
Run Spark on your laptop, no matter how many cores do you own, you can have only one executor
-
There will be some latency (~10 minutes) for the backpressure to take effect

-
Cannot count too much on backpressure
- You see the import rate drops after some time, but scheduling latency doesn't recover
- Not sure about 'spark.streaming.backpressure.initialRate''s equivalent in kafka direct API.
-
Change the batch interval, the processing time will also change slightly
- (batch interval: 2.5, proce time: 1.8) --> (batch interval: 2, proce time: 2.1)

- Apache Log Files
- Unit Testing TCP Server & Client with Python
- How to choose the number of topicspartitions in a kafka cluster
- kafka direct + spark streaming + checkpoints + code changes
- Four Things to Know About Reliable Spark Streaming with Typesafe and Databricks
- Spark & Kafka - Achieving zero data-loss
- Exploring Stateful Streaming with Apache Spark
See the LICENSE file for license rights and limitations (MIT).