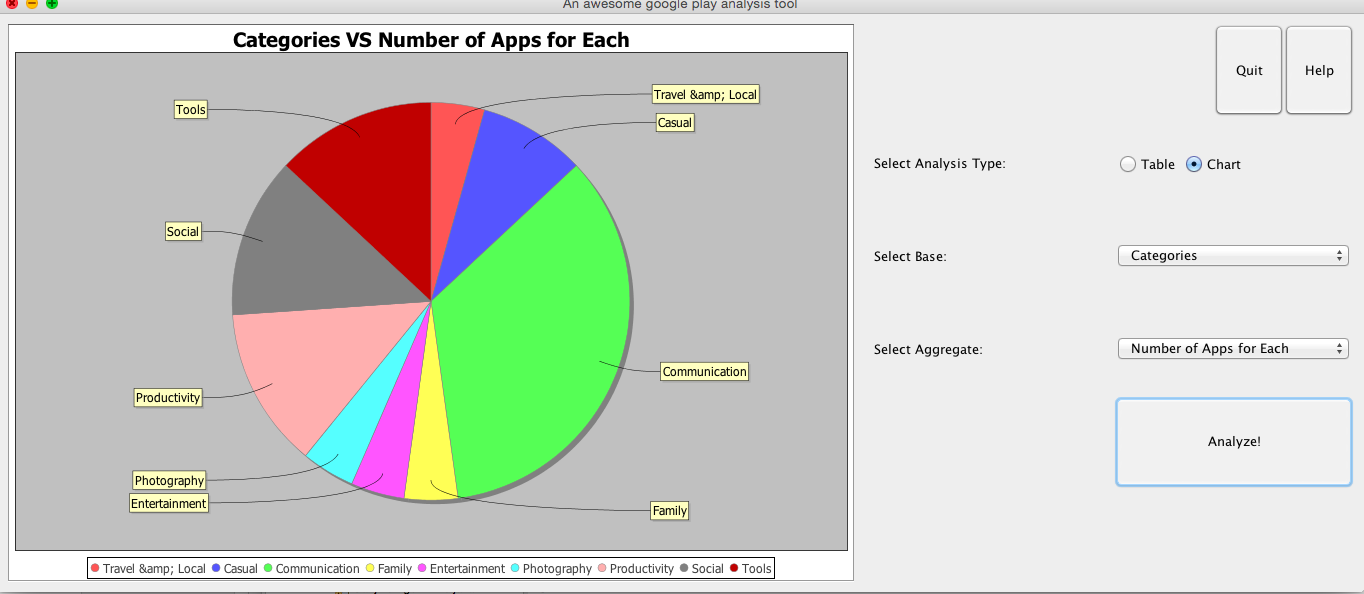
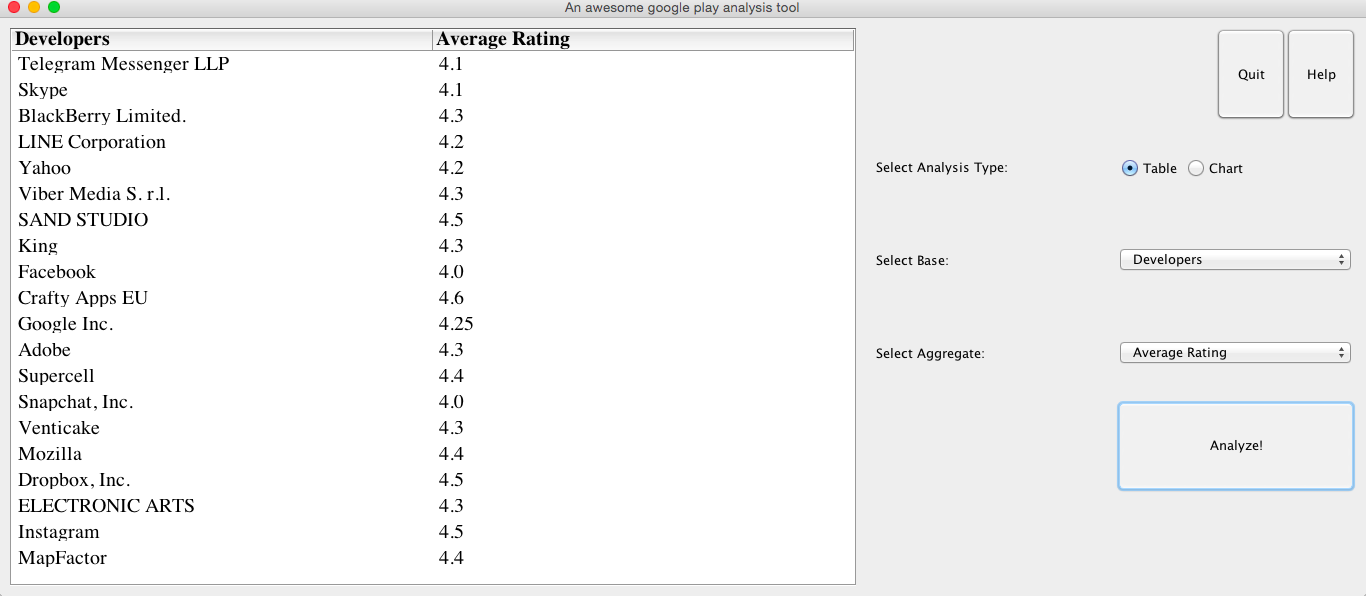
In this school project, We implemented a small data visualization tool for app info stored in CSV.
It provides a visualized analysis on the developer's level, for example: display the average rating for each developer. It is complemented by another project (google_app_crawler_analyzer )which has info about an individual app.
In order to run this program, you need 4 libraries: jcommons, jfreechart, kxml and xstream.
The app supports two types of analysis, list and chart.
You have to choose a base element and an aggregate element. For example, 'developers' as base and 'total number of apps' as aggregate will give you the number of apps for each developer. You can also order the result in both orders.

