This repo is part of the WCMA TRICMA project, which is attempting to take data out of an eMuseum TMS system and let 3rd part developers consume that data via an API endpoint.
The dashboards role is to connect to TMS systems to extract data, and allow users to upload JSON files (of a specific format), and then aggregate that data into a data store, as well as extracting and storing images for that data.
While also managing Admin, Staff and (3rd party) developer user roles, admin healthcheck views of the system and developer documentation.
It is, in short a "dashboard" where people of various roles can manage various tools.
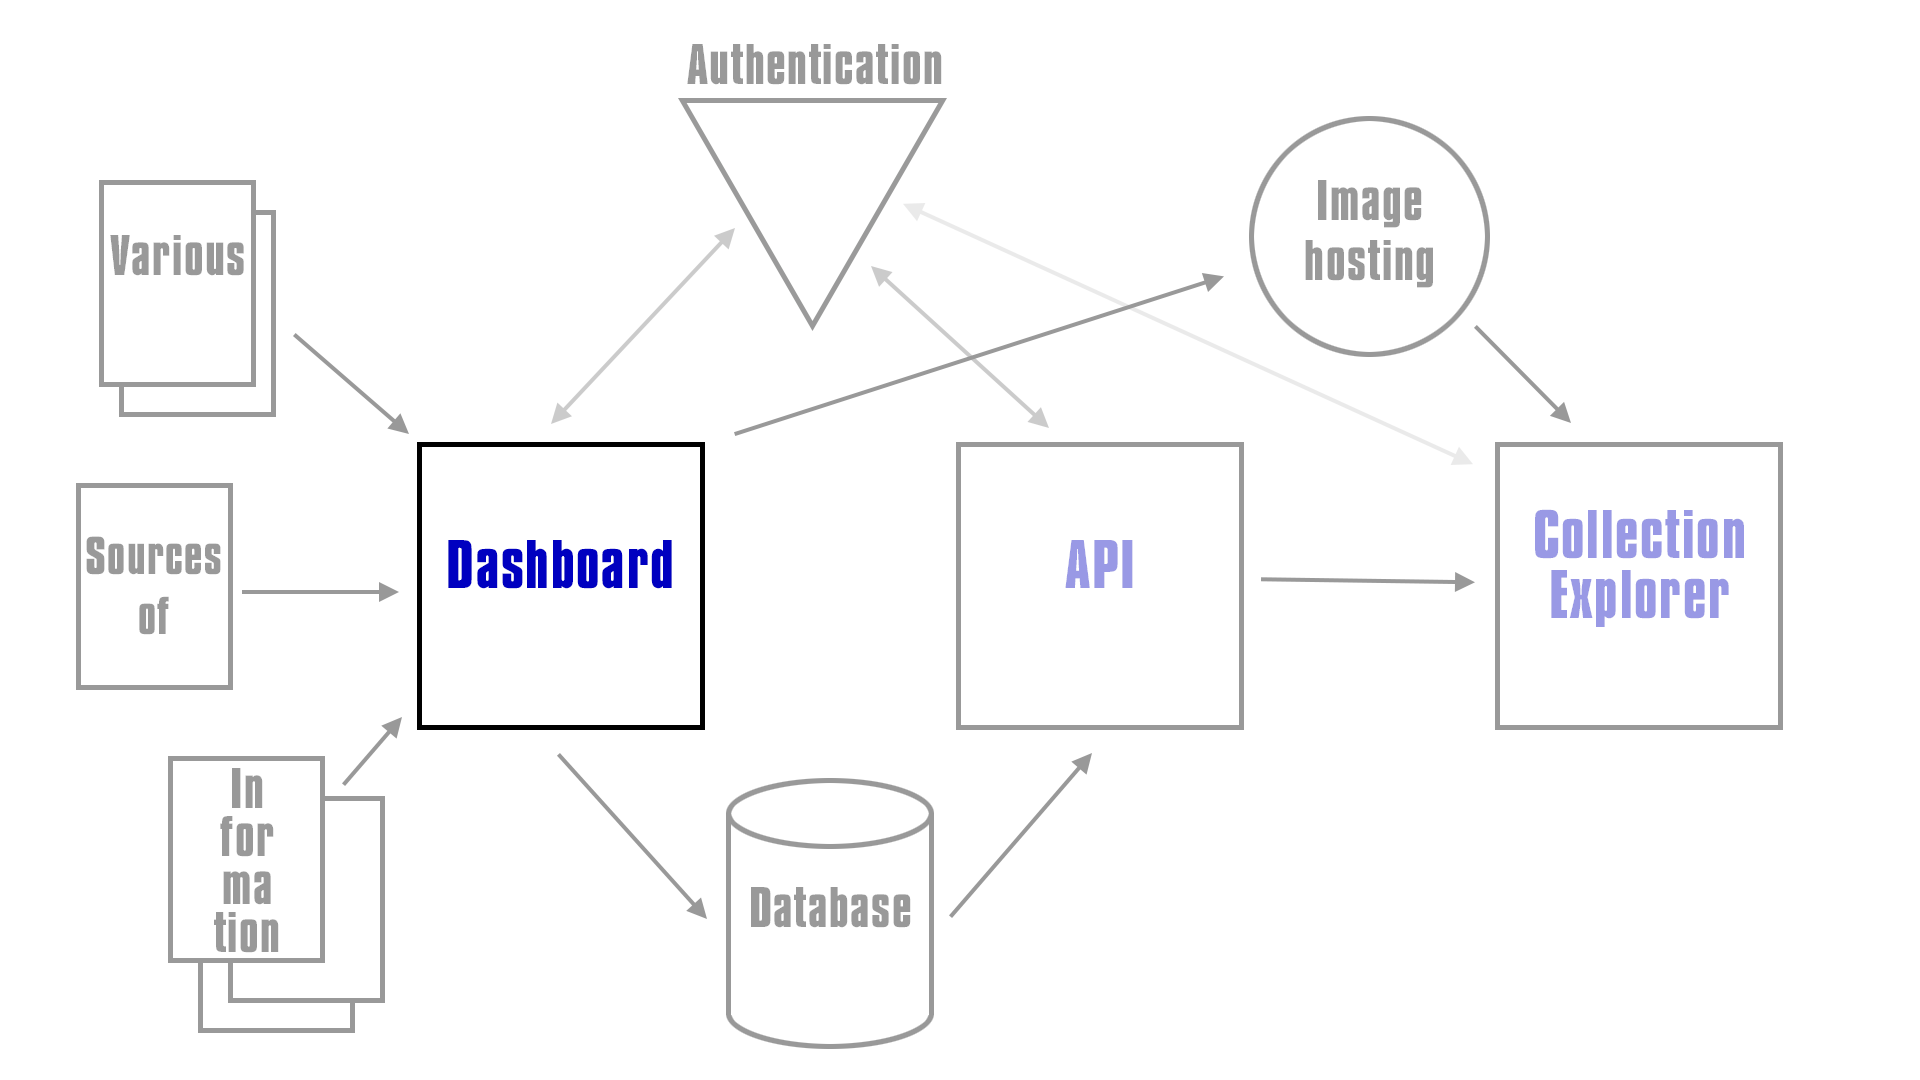
This is where the Dashboard fits into the overall architecture of the system, see the TRICMA repo for more details of the overall system.
- Installation
- Running for the first time
- Configuring and connecting to everything
- Admin tools
- Staff tools
- 3rd party developer tools
- Working with this code for developers
Below you will find all the notes you need to get up and running with the dashboard, note this has been tested on OSX and ubuntu, as for Windows ¯_(ツ)_/¯
Before anything else you will need to make sure you have installed the following...
Then clone the repository and read the next section before doing anything else.
You will probably also need to...
- Set up an instance of ElasticSearch and Kibana
- Sign up to Auth0
- Create an account on Cloudinary
...I advise setting up a "developer" and "production" version of each of the above, unless you intend on running just a developer version or just a production version. And hey, staging too if you wish.
The code has been written so that running yarn start will install all the node modules you need (this may take a while the first time), build the code and start the app, it will also start a "watcher" that will watch for code changes and restart the app. This means you don't have to use nodemon or any other tools, just run yarn start and you should be good to go.
(Note: to restart the app it attempts to kill the old process and starts a new one. Sometimes for various reasons an old version of the app may be left running, it will always write a file called .pid in the app's root directory should you need to kill the app by hand, with kill -9 $(cat .pid))
There are a couple of useful command line parameters you can use...
--skipOpen will start the app without trying to open a browser.
--skipBuild will start the app without running a yarn install or rebuilding any of the node or css files.
--skipStart will make it so the app and any code watching doesn't start. Use this when you just want to rebuild the code but not actually start anything.
After your first yarn start you should read Running for the first time in development
Running yarn start in production mode will install all the node modules you need, build the code and then start the app. Unlike running in development mode it will not create a watcher to watch for code changes.
If you are using a process manager tool like PM2 (github.com/Unitech/pm2) restarting the app with pm2 restart [app id|name] (say after a git pull, or deploy) will repeat the check for new modules and rebuild the code before starting.
If you wish to run the traditional yarn install and build step yourself you can use the --skipBuild option.
You can also specify port, host and environment directly on the commandline, for example...
yarn start --port 4002 --host localhost --env production
...there's more information on this in Running for the first time in production.
An example of a new "deploy" once you have PM2 running the dashboard may look like...
git pullpm2 restart dashboard
If you initially started the app in PM2 with the skikBuild option i.e. yarn start --skipBuild then your deply would need an extra build step in.
git pullyarn start --skipStartpm2 restart dashboard
The second method is preferable to take advantage of pm2's hot reloading, as it will rebuild the code before restarting, while in the first method will cause the app to be down for the length of time it takes to build the code.
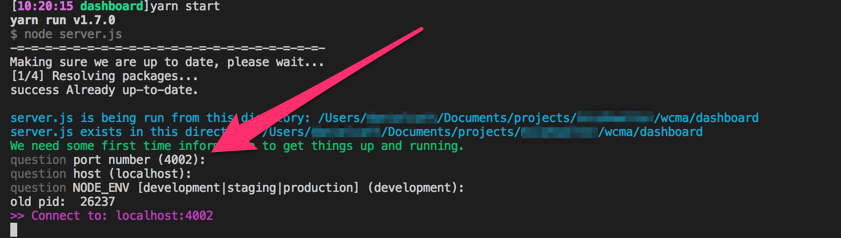
When you run yarn start for the first time it will (after installing packages) ask you a few questions about your environment, it will ask you for the port, host and what your NODE_ENV should be. Hitting return accepts the defaults of 4002, localhost and development. It will look something like this...
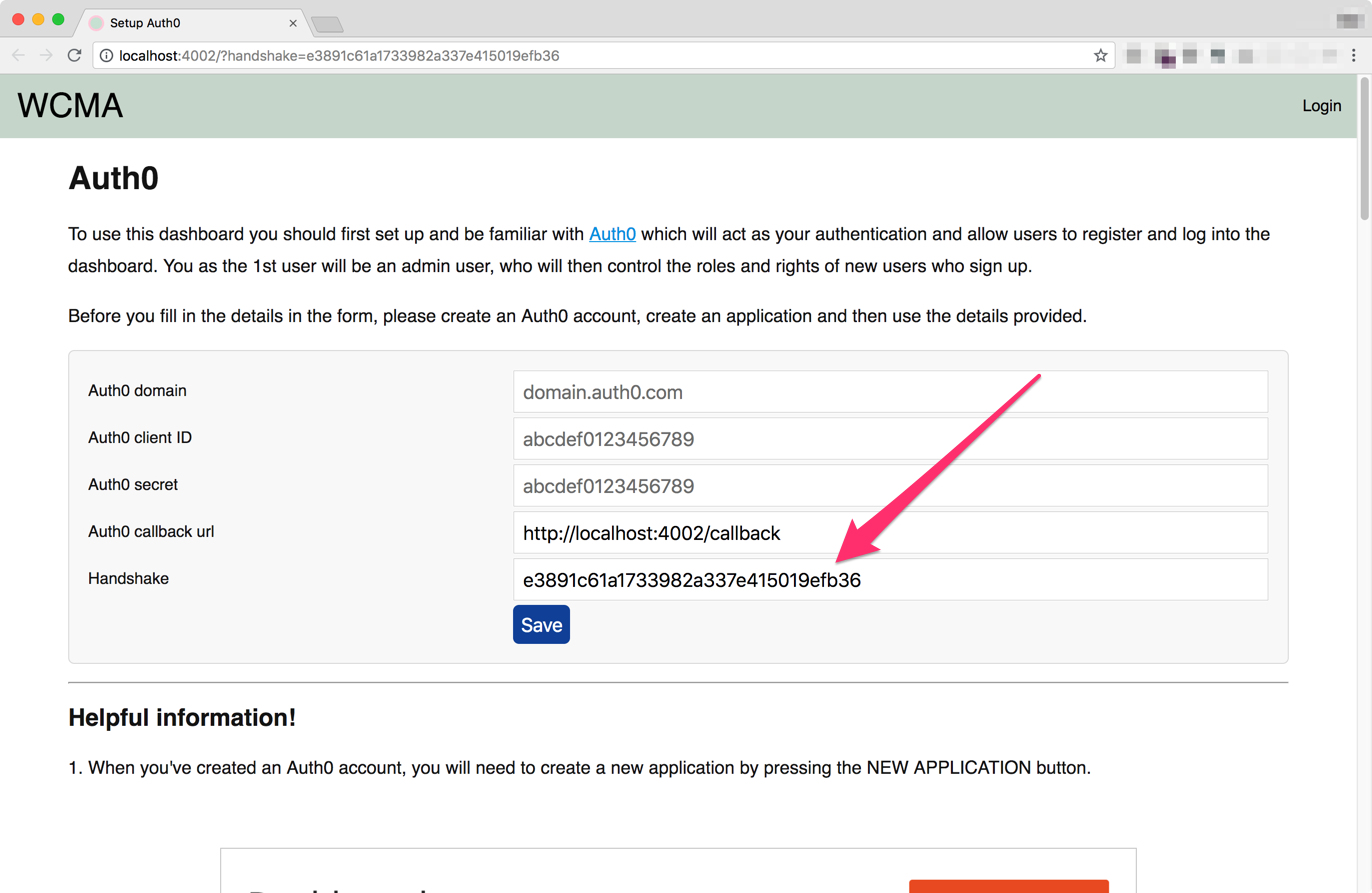
A browser will start and ask you for your Auth0 account details. There's more information on the page, but if you've already created your Auth0 account and application you should have your Auth0 domain, client ID and secret.
It will also ask for a Handshake value, if you're running development and locally this should already be filled in for you.
When running on a production server things are slightly different. Because the moment you start it up on a staging/production server it may be open to the world, anyone has access to the form. Only a person with the handshake value will be able to successfully submit the form. When starting the app in staging/production mode it will display the handshake on the command line...
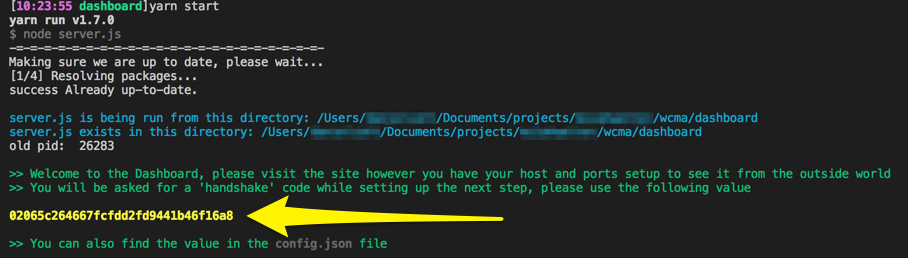
...you can also find the handshake value in the config.json file that is created.
The app will attempt to reload at this point. If this fails just restart the app again with yarn start
It will now ask you to log in, the first user to log in will automatically become the Admin user, so you should probably do this asap :)
Once you have logged in the first thing you need to do is set up connections to all the things, heading to the "Config" page will give you a set of forms like this...
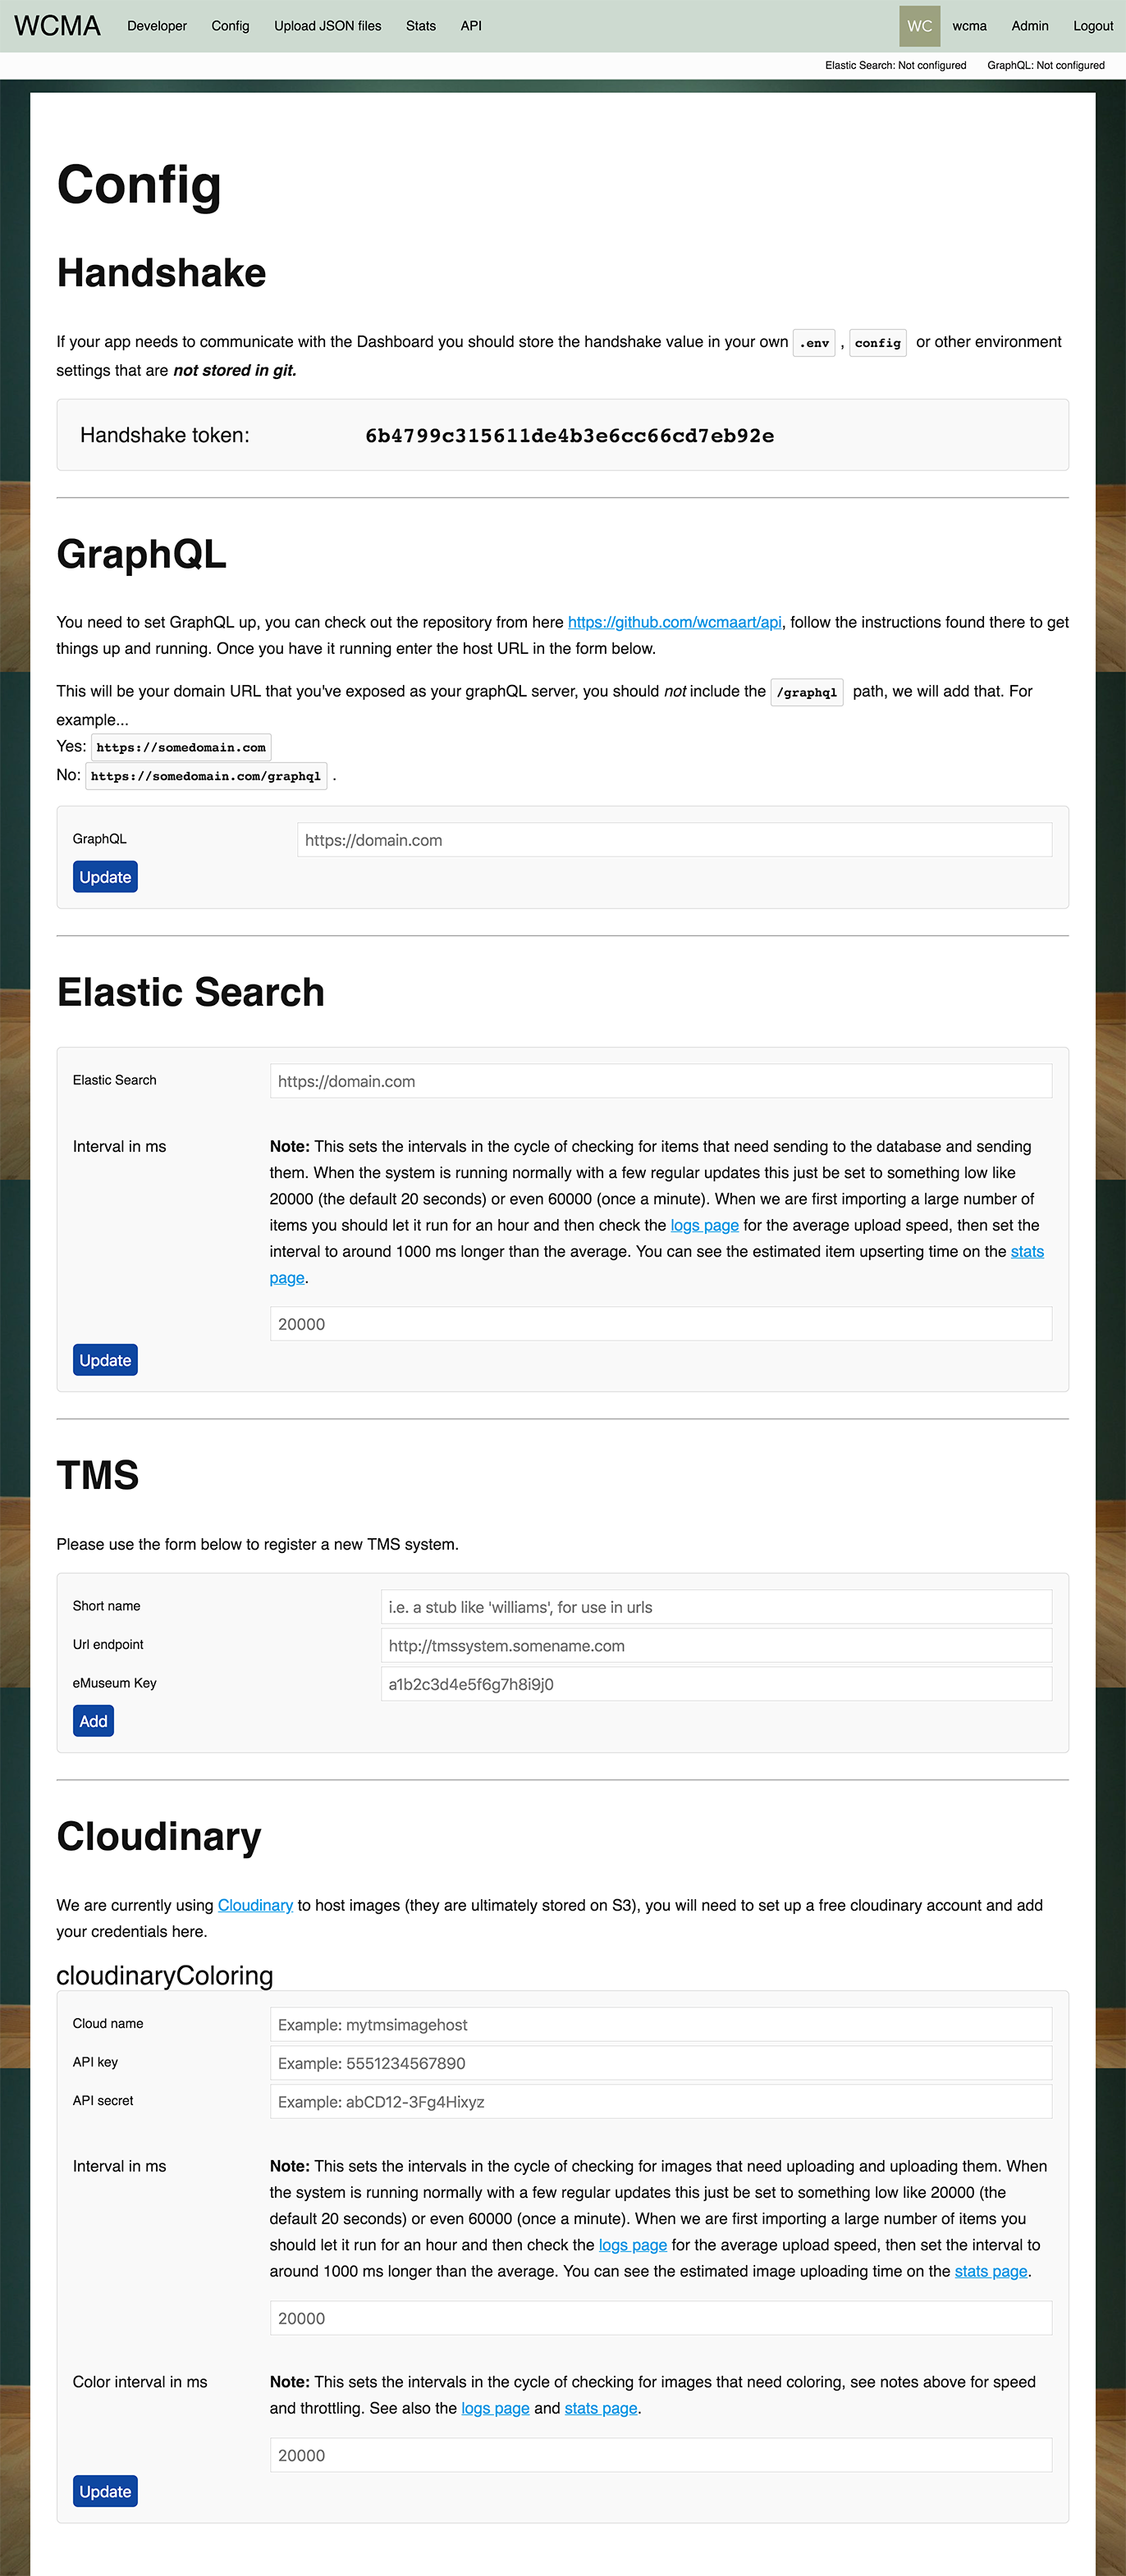
This one is optional but not really, letting the dashboard know where the GraphQL is hosted allows it to dynamically create links in the developer documentation. Once you have your GraphQL api endpoint up and running set it up here. Follow the instructions on the GraphQL repo for details.
This is the location of your ElasticSearch instance.
The Interval in ms setting is quite important, when the system is up and running we'll be doing things like uploading JSON files with objects, events and such like. The dashboard will split those up into individual files for processing and "upserting" to the Elastic Search database. This interval setting is how frequently it'll attempt to look for and "upsert" new items.
See Speeding up and slowing down data handling for more help.
In day to day running we expect there to be one or two new or modified objects and events per day, or even a hundred or so if a lot of new objects are added in one go. The default interval of 20,000ms means the system would upoload 120 new objects in 40 minutes, which is generally fine.
Should you wish to "upsert" objects faster (for example the first time we upload a JSON file), then you can lower the interval down to something much lower. You can check the average time for a round trip "upserting" an object to Elastic Search on the Logs page. The lowest you should set the interval to is 1,000ms higher than the average.
This is the location and eMuseum key used to connect to your TMS system. When registering a system you should a "short name", this should be unique between TMS systems.
This is becuase we want to unify sources of data from many different places. It's possible that we may have two or more TMS systems and we want to merge the data into one GraphQL api end point. But objects across TMS system may share IDs. The shortname or "stub" allows us to differentiate between objects sharing IDs.
Once you've set up a cloudinary account you should enter the details here.
The system extracts image information for each object from the TMS system. An object will only be "upserted" to Elastic Search once we've checked to see if it has an image and uploaded it to Cloundary if it has one. The speed of uploading images to Cloudinary is the bottleneck to "upserting" all the objects.
See the notes about Interval in ms setting in the Elastic Search section above for more details about how you can tune the value to balance rate of upload vs CPU/network processing time. Or see Speeding up and slowing down data handling for more help.
Setting the value too low will get the images uploaded faster but will "thrash" the system. While in developement and inital deploy this may be fine, once everything is running smoothly the value should be set down to a more relaxed value.
This page gives the admin users a set of tools to help manage and run the system. Currently this is limited to managing users. Admin users also get access to The config page
The users page allows you to select users see their creation and last login time, along with their roles. Selecting a user lets you toggle their roles of Admin, Staff and Developer.
Admin users have full access. Staff users have access to the Upload JSON and Stats page, so they can upload new objects and see the overall health of the system. Developers can see all the developer documentation and the health check pages for the ElasticSearch and GraphQL endpoints.
The system has been designed to break things down into small tasks. For example, it will take a JSON file full of Objects and turn them into individual JSON files. Then it processes these as "small pieces loosly joined" almost like a queueing system.
One tasks may be checking the TMS system for new objects, if it finds them it'll mark them as needing their images uploaded to Cloudinary. While another task will check for new or modified objects that have an image record and updates the ElasticSearch database. While yet another task is asking Cloudinary for color information.
The config page allows an admin user to change the rate at which these tasks run. During normal running of the system these may be set to low values, such as every 20 seconds or every minute. This is on the basis that a handful of new objects may be added daily and it'll take just a few minutes to an hour or two overnight to get everything updated.
The stats page will display estimated times for tasks that need to run, here is an example...
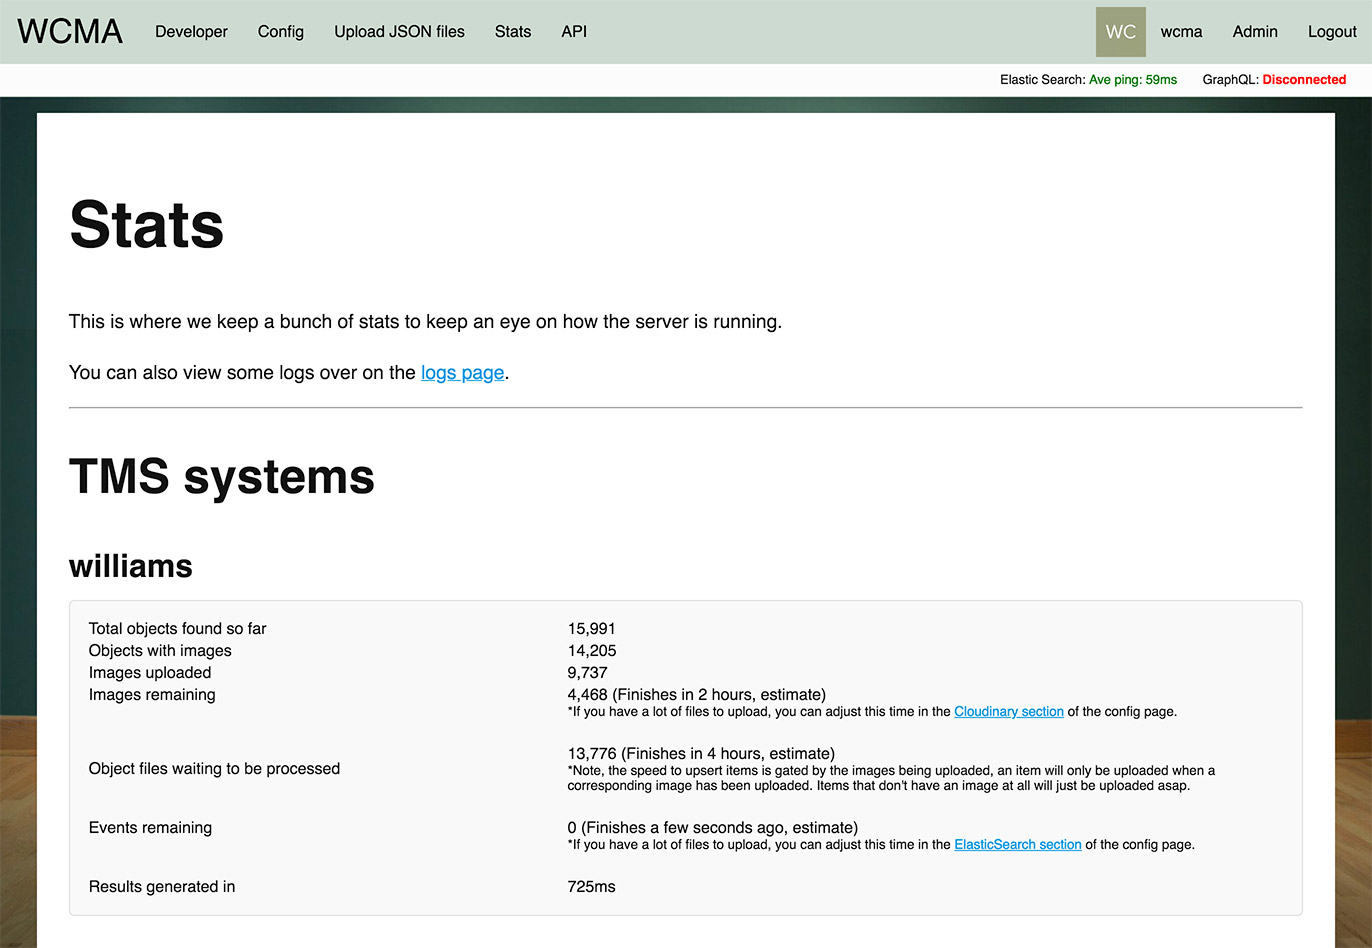
Here is is telling us that it's going to take about 4 hours to upload everything. This is because we've set a very low/quick interval time.
A good way to work out what to set an interval to, if you need to speed things up, for example the first time you upload a JSON file, is to let things run for a while and then look at the logs page (see Reading logs). The top of the page gives you a quick breakdown of times, it may look like this...
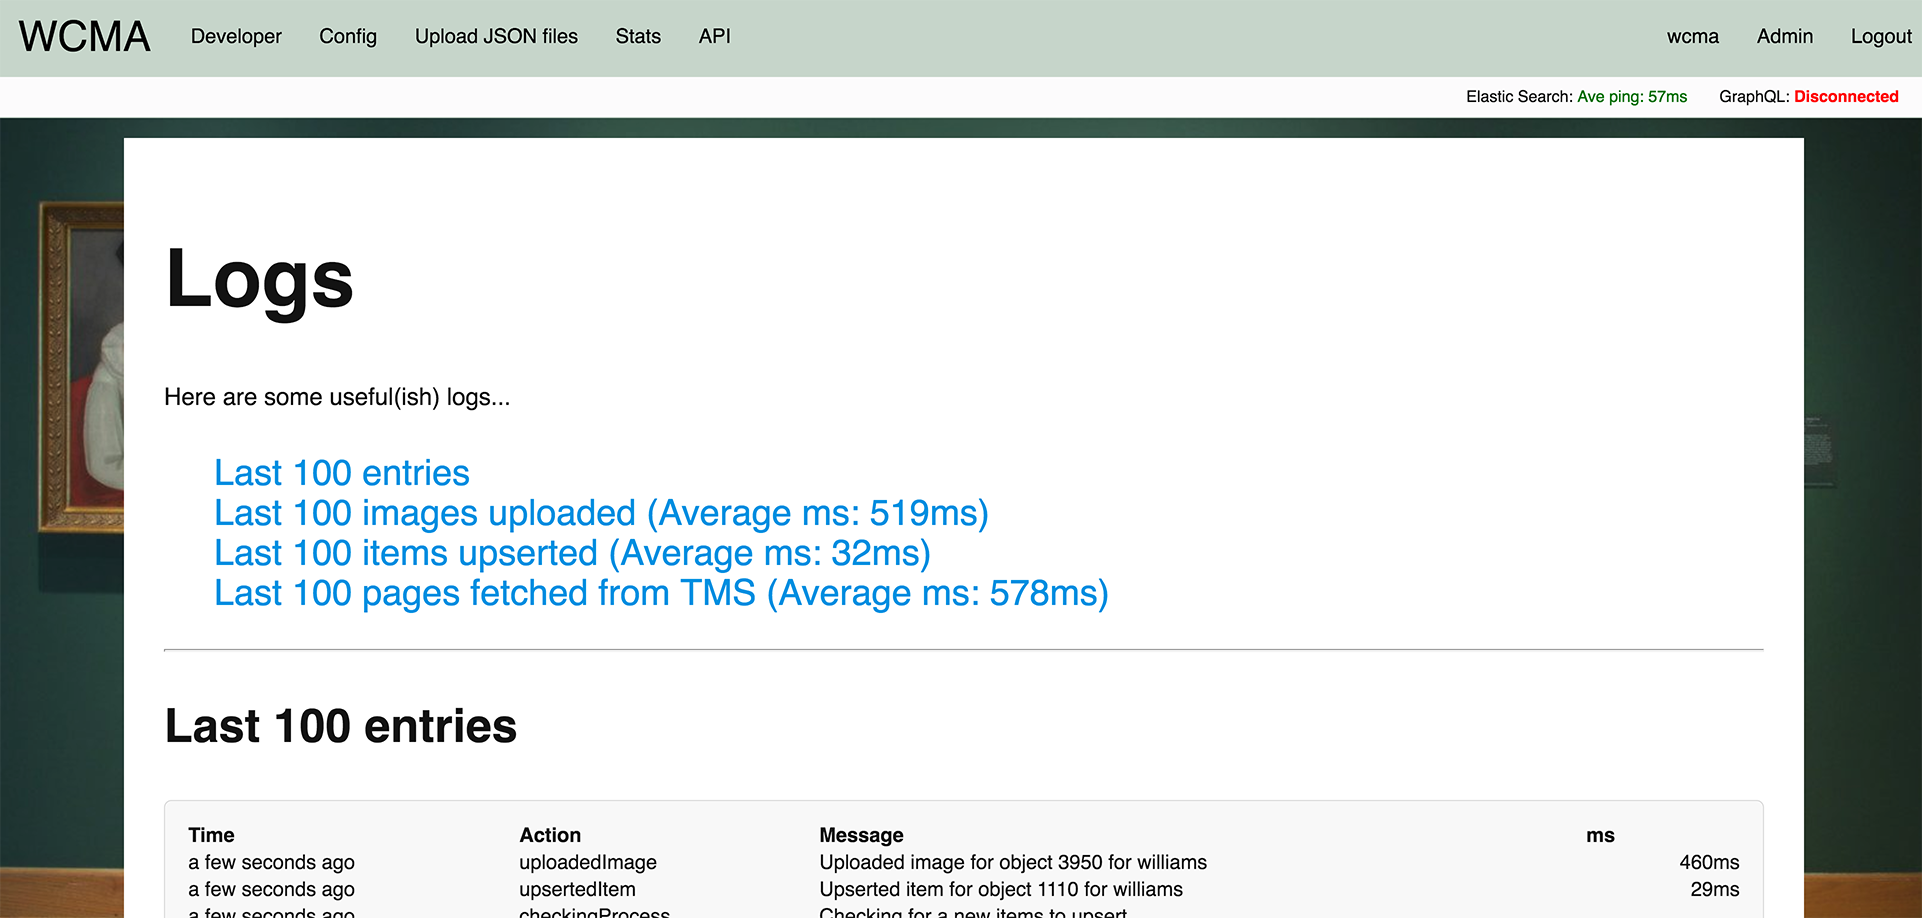
Which is telling is that on average it's taking 519ms to upload an image to Cloudinary. The lowest we should set our image uploading interval to is 1,000ms higher than the average. In this case a value of 1,500ms seems about right, or one image upload every 1.5 seconds.
Which, a back of a napkin calculations tells us we'll upload about 40 images per minute or 2,400 images per hour. The Stats page told us we had 4,468 images left to upload, at our rate of 2,400 images per hour (1,500ms per image), they should all be uploaded in around 1h48m, or "about 2 hours" as our stats page says.
Once all images have been uploaded then we should set the interval back down to something sensible otherwise it'll keep checking for new images to upload every second and a half, which is unnecessary thrashing of the system.
The config page is where connections and time intervals are set up. The sections on this page have already been described above in GraphQL, Elastic Search, TMS systems and Cloudinary.
There are a number of pages that are accessible to the staff role. Most of these are for monitoring the health of the system.
The stats page tells us how many objects the system knows about and how many other tasks it has left to do and how long it will be until those tasks have finished. This is a high level view of what is going on.
The top of the page, just under the logout link is a quick at a glance status of the connection to Elastic Search and GraphQL endpoints. Clicking on those will take you to the system status pages.
We use the Winston logger to log a whole bunch of stuff. Whenever the system attempts to do something it'll make a log of it. If you have access to the server you'll find these in the logs/tms folder.
The logs page will however give you a quick overview of the last 100 entries and a further break down into sections.
Each log is broken down into Time, Action, Message and ms (if applicable). Note: there's slightly more information in the actual logs that's not shown on this page, mostly full error message dumps when an error has taken places.
You can also see at a glance the following breakdowns; Images uploaded and images colored are all about image management, while items upserted, events upserted and pages from the TMS looking for new items are all concerned with keeping the objects and events synchronised.
Where possible the round-trip tim eto complete the tasks is included, which is useful for keeping an eye on the overall health of the network and external services.
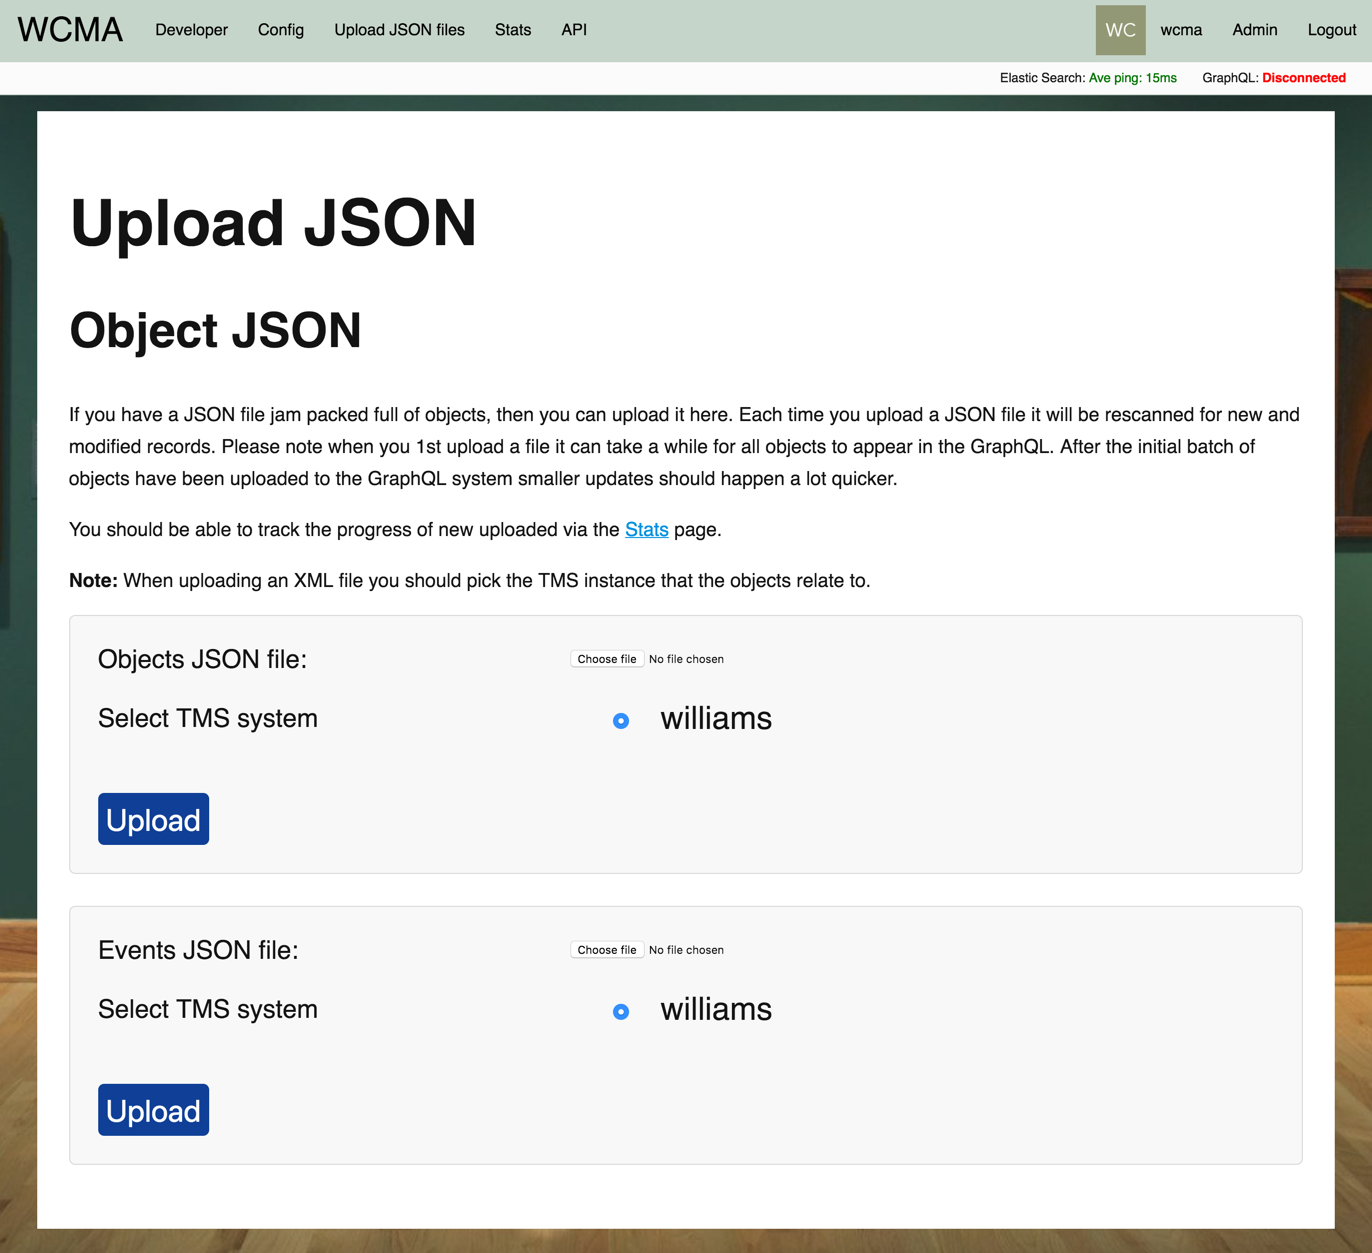
There are two places where information gets into the system. One is by direct connecton to the TMS system where some information is extracted. Additional information can be supplemented via JSON files, which are uploaded on the "Upload JSON files" page.
Note: the code handles JSON being formatted in a specific way and developers should be consulted to make sure the backend can handle a new format.
When a JSON file is uploaded it is split into separate entities which are queued for upserting to the database. Only entities that are new or have been modified since the last time they were seen are queued this way. Therefor you can upload full JSON files and not worry about uploading duplicates.
When a JSON file upload is complete it will show you all the unique fields it found including any new ones, you can use this information to check against any schemas you're using for GraphQL queries as well as checking them against your expections.
These fields are also outputted into the following files...
data/events/[tms stub]/eventFields.json
data/tms/[tms stub]/objectFields.json
TO BE ADDED
TO BE ADDED
(basically, 3rd party developers can sign up and then they can see their API token, system status and developer documention)
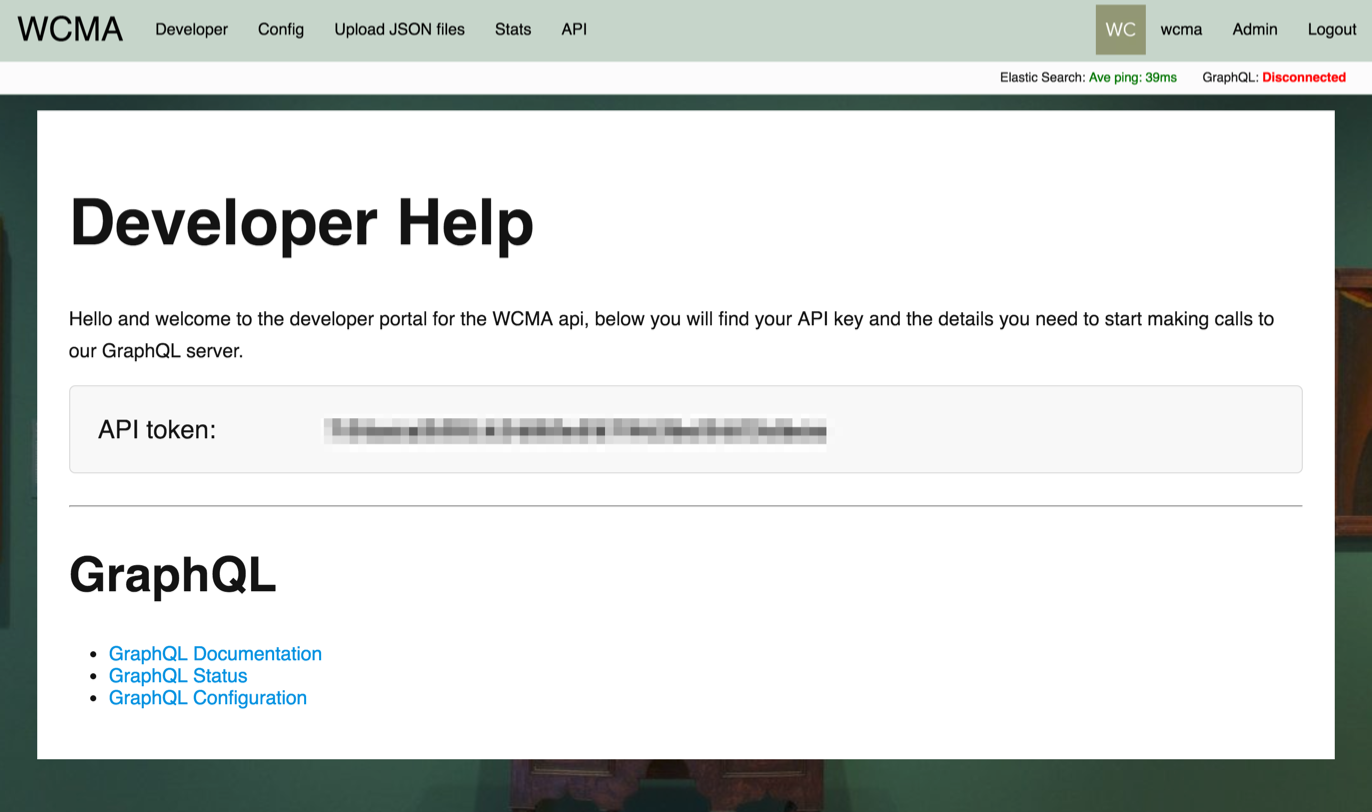
Clicking on the "Developer" page will show you your API key and links to the status pages and developer documentation.
The developer documentation details how to call the GraphQL api end points, using your API token. The developers page is where you can find that token.
TO BE EXPANDED
A developer can get a general over view of how the GraphQL api endpoint is doing by clicking the "GraphQL Status" link, this takes the user to a page showing ping times for the last 20 minutes. If the server restarts then this list will be cleared and updated once a minute.
The developer can also get to this page by clicking the "GraphQL: [status]" link in the top sub-navigation bar, along with the Elastic Search status.
Developer documention can be found here, including example code...
TO BE EXPANDED
TO BE EXPANDED
Quick notes about the code: essentially this code is 10% scripts, 30% error checking on those scripts and 60% UI webpages to make it easy(ier) for none technical users to use the system and see what's going on.
The aim of the system is essence to...
- Connect to the TMS system and extract information
- Parse JSON files to extract information
- Put the information into a data store
- Upload images somewhere
This is completed by the core 10% scripts that are detailed in the following sections.
The 30% code is making sure those scripts run and don't fall over should they encounter something expected and a logging system to record everything it's trying to do.
The 60% UI webpages is reporting on the tasks and logs and letting users configure certain settings, basically a front-end to updating a config.json file. And then all the error checking on the user submitted information.
In short, yes you could boil all this down into some simple scripts, but no, that's not what this app is trying to do.
TO BE EXPANDED
TO BE EXPANDED
TO BE EXPANDED
TO BE EXPANDED
TO BE EXPANDED