Welcome to the repository! Here are collected plots for analysis of country's socio-economic status. It is aimed primarily for academia of Social Science, such as Economists, Sociologists and Political Scientists, but also can be applied in other places (for example, Marketing).
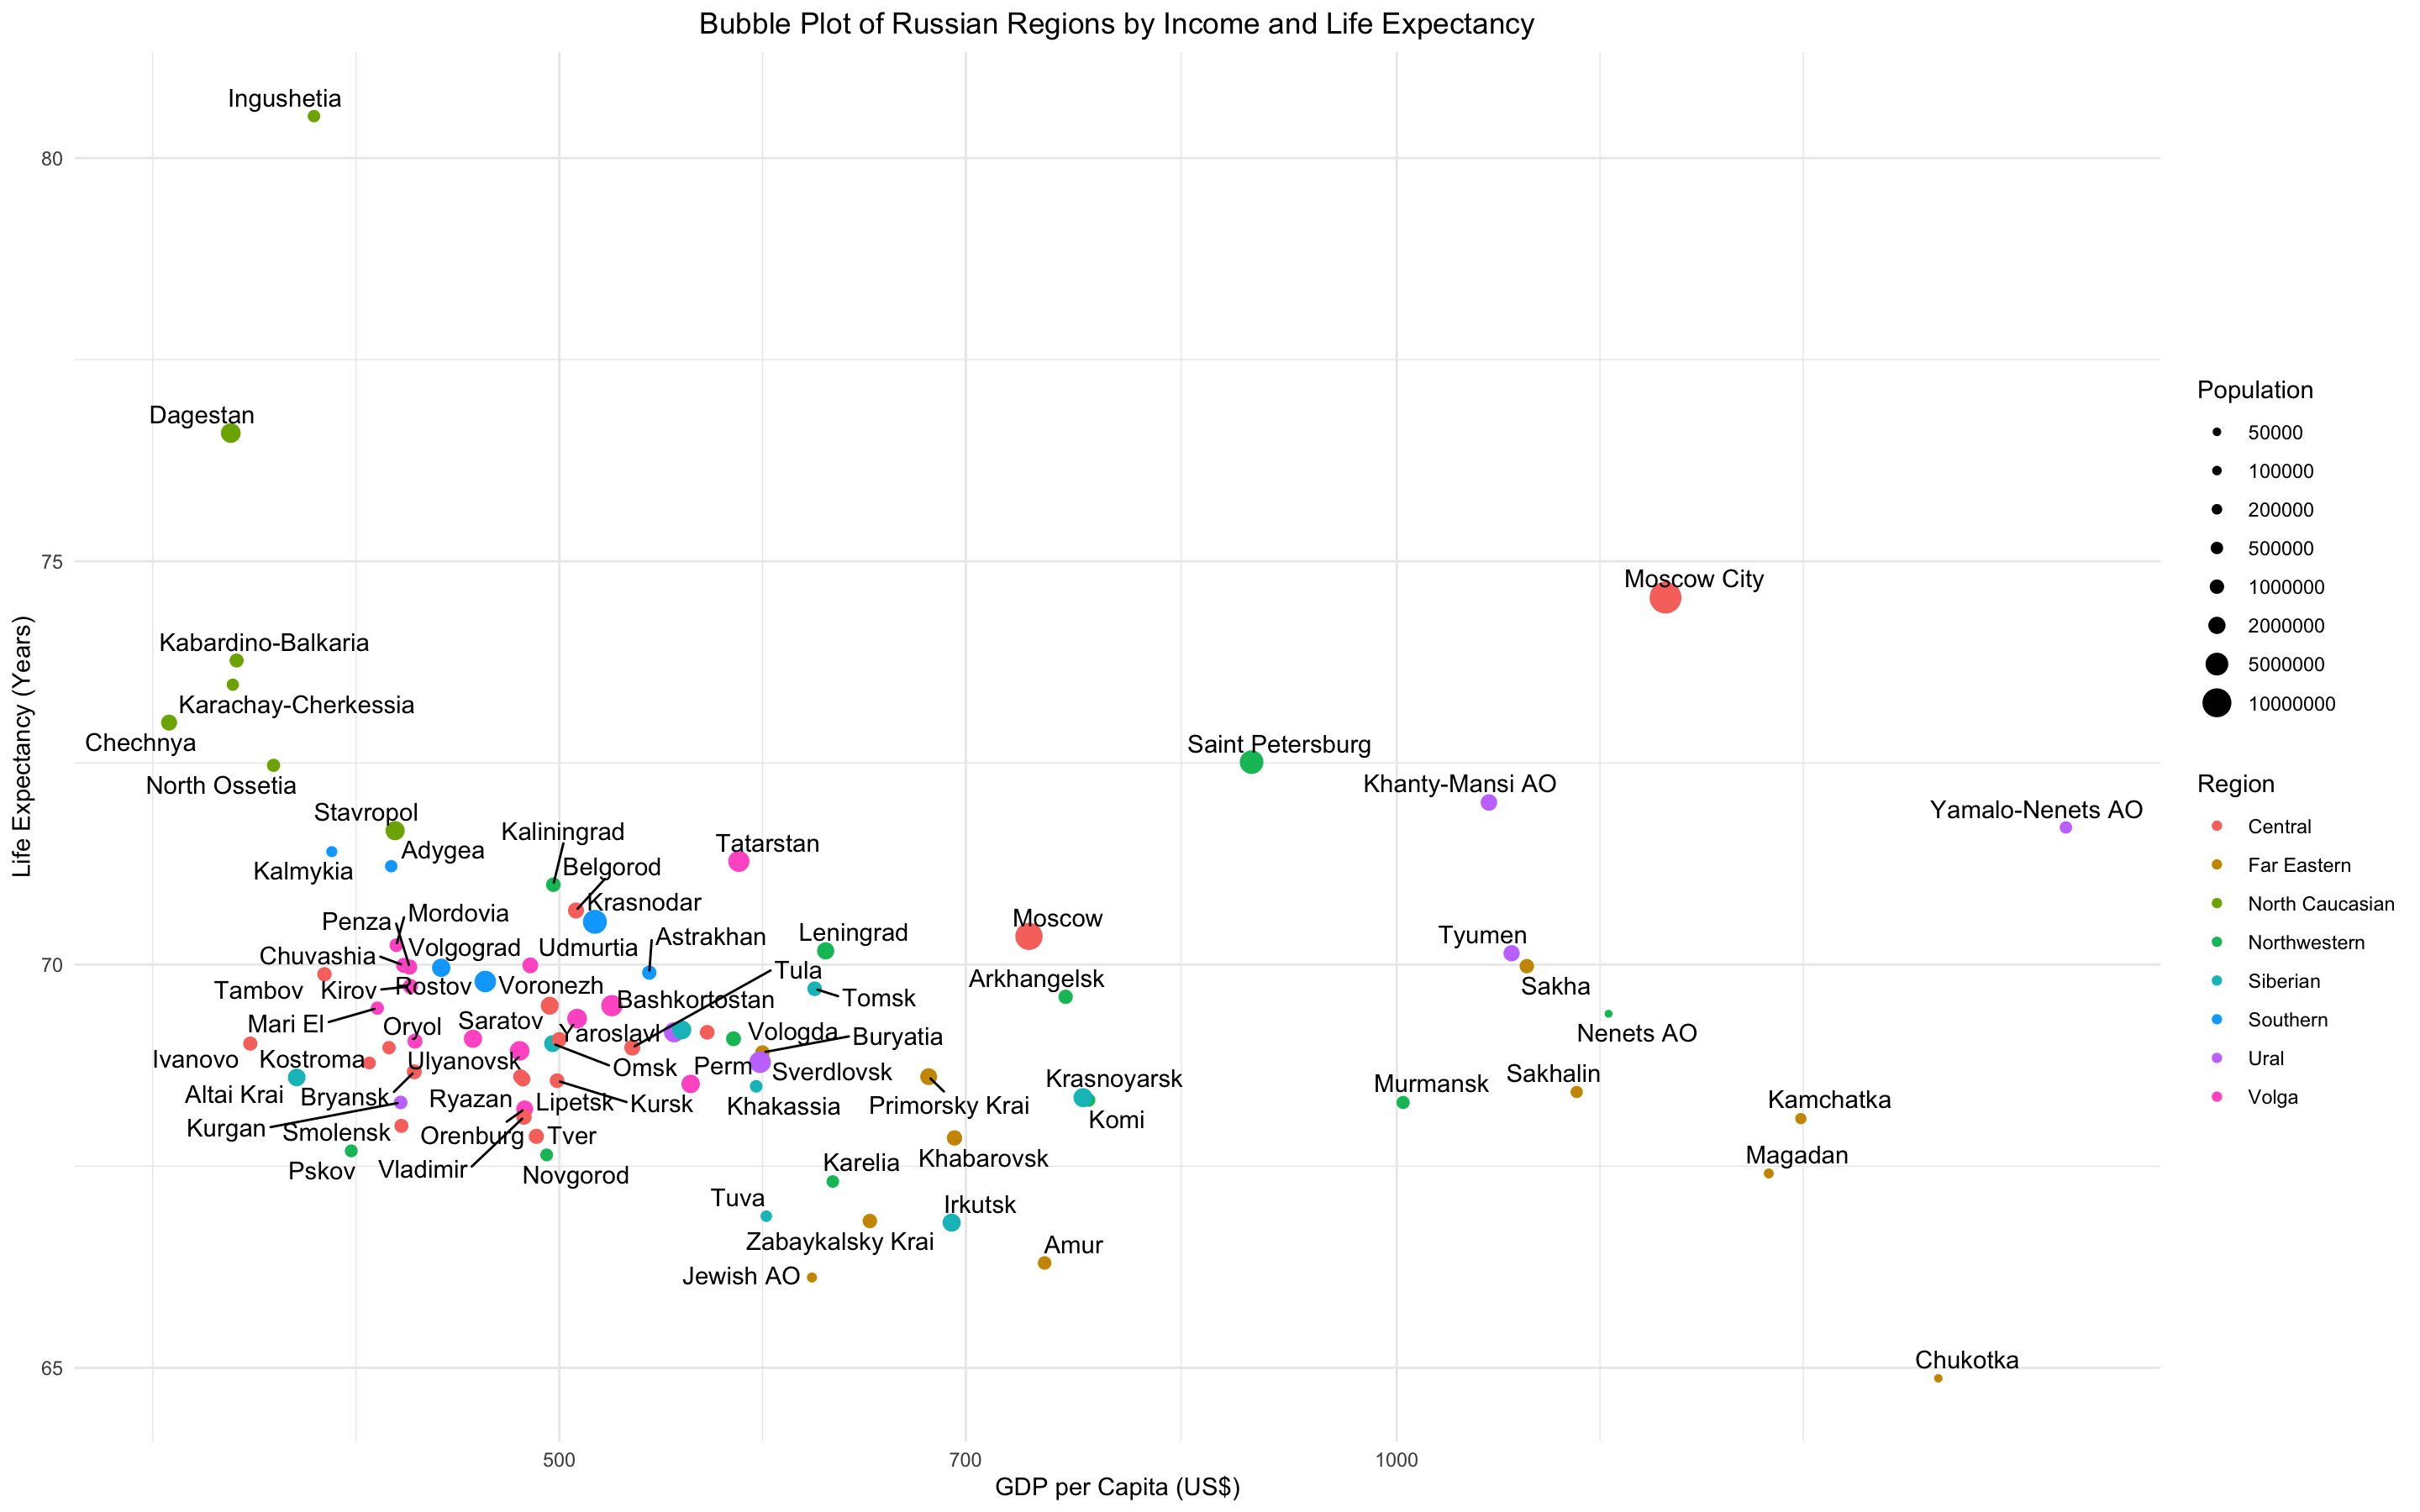
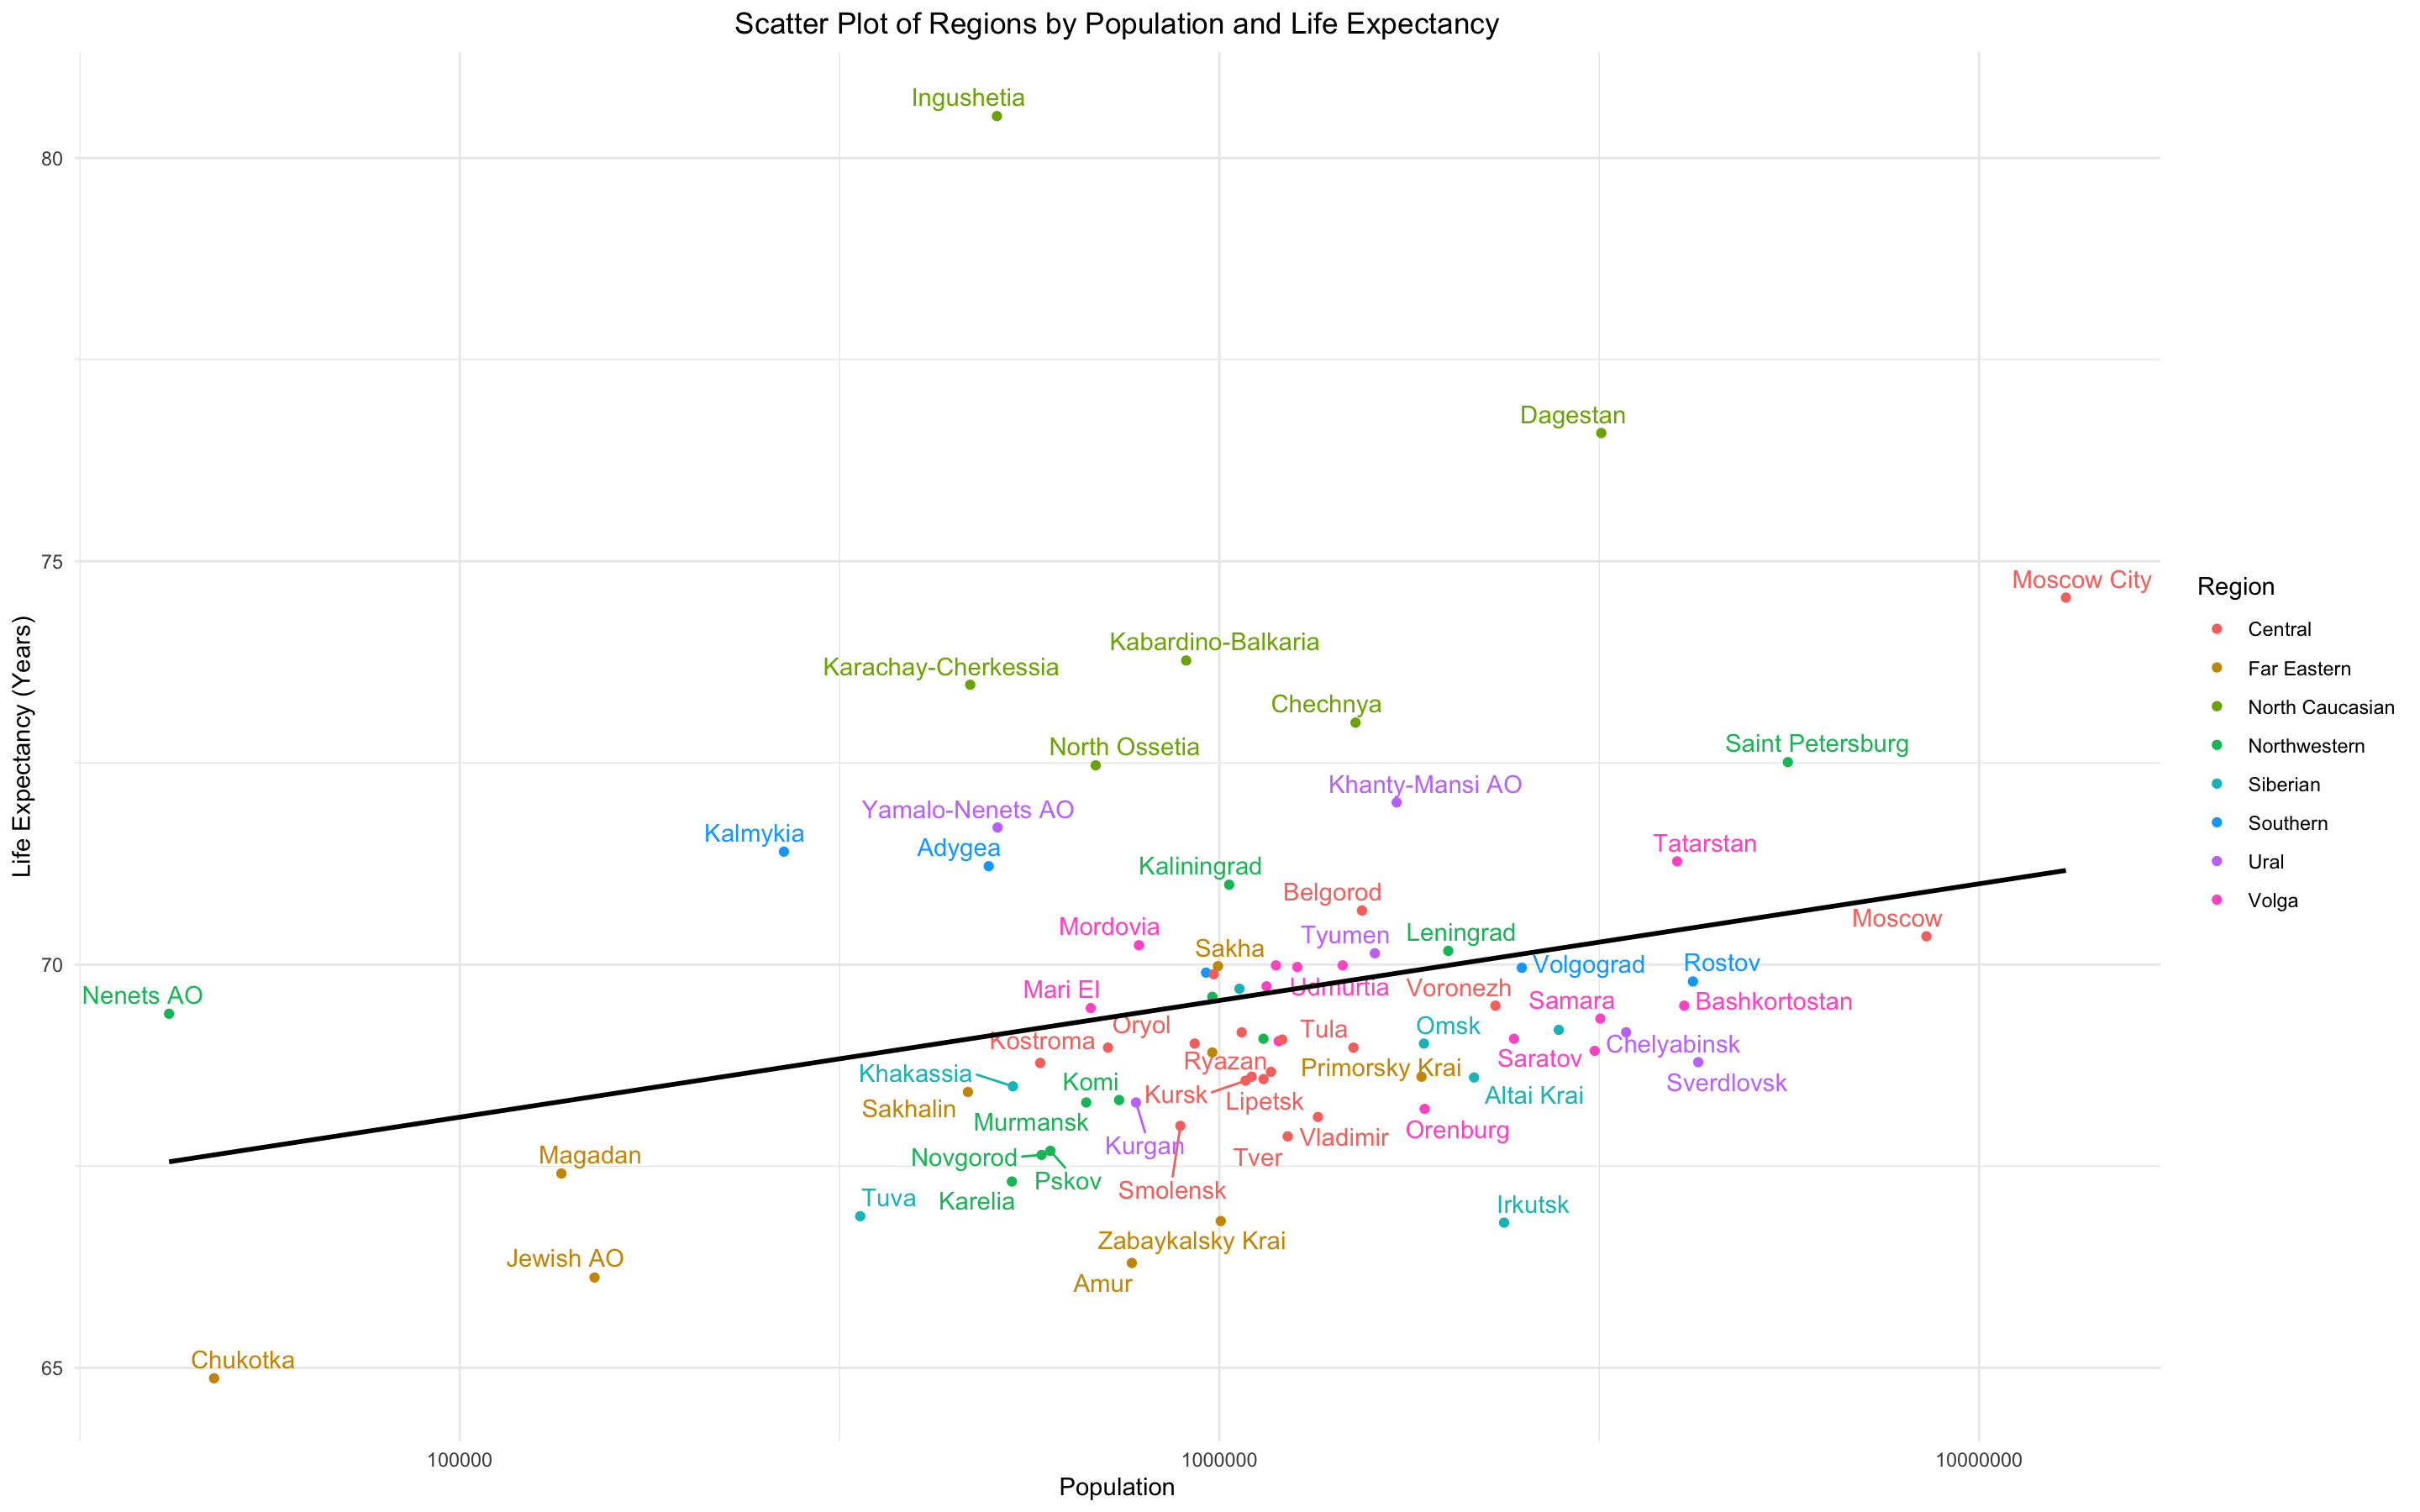
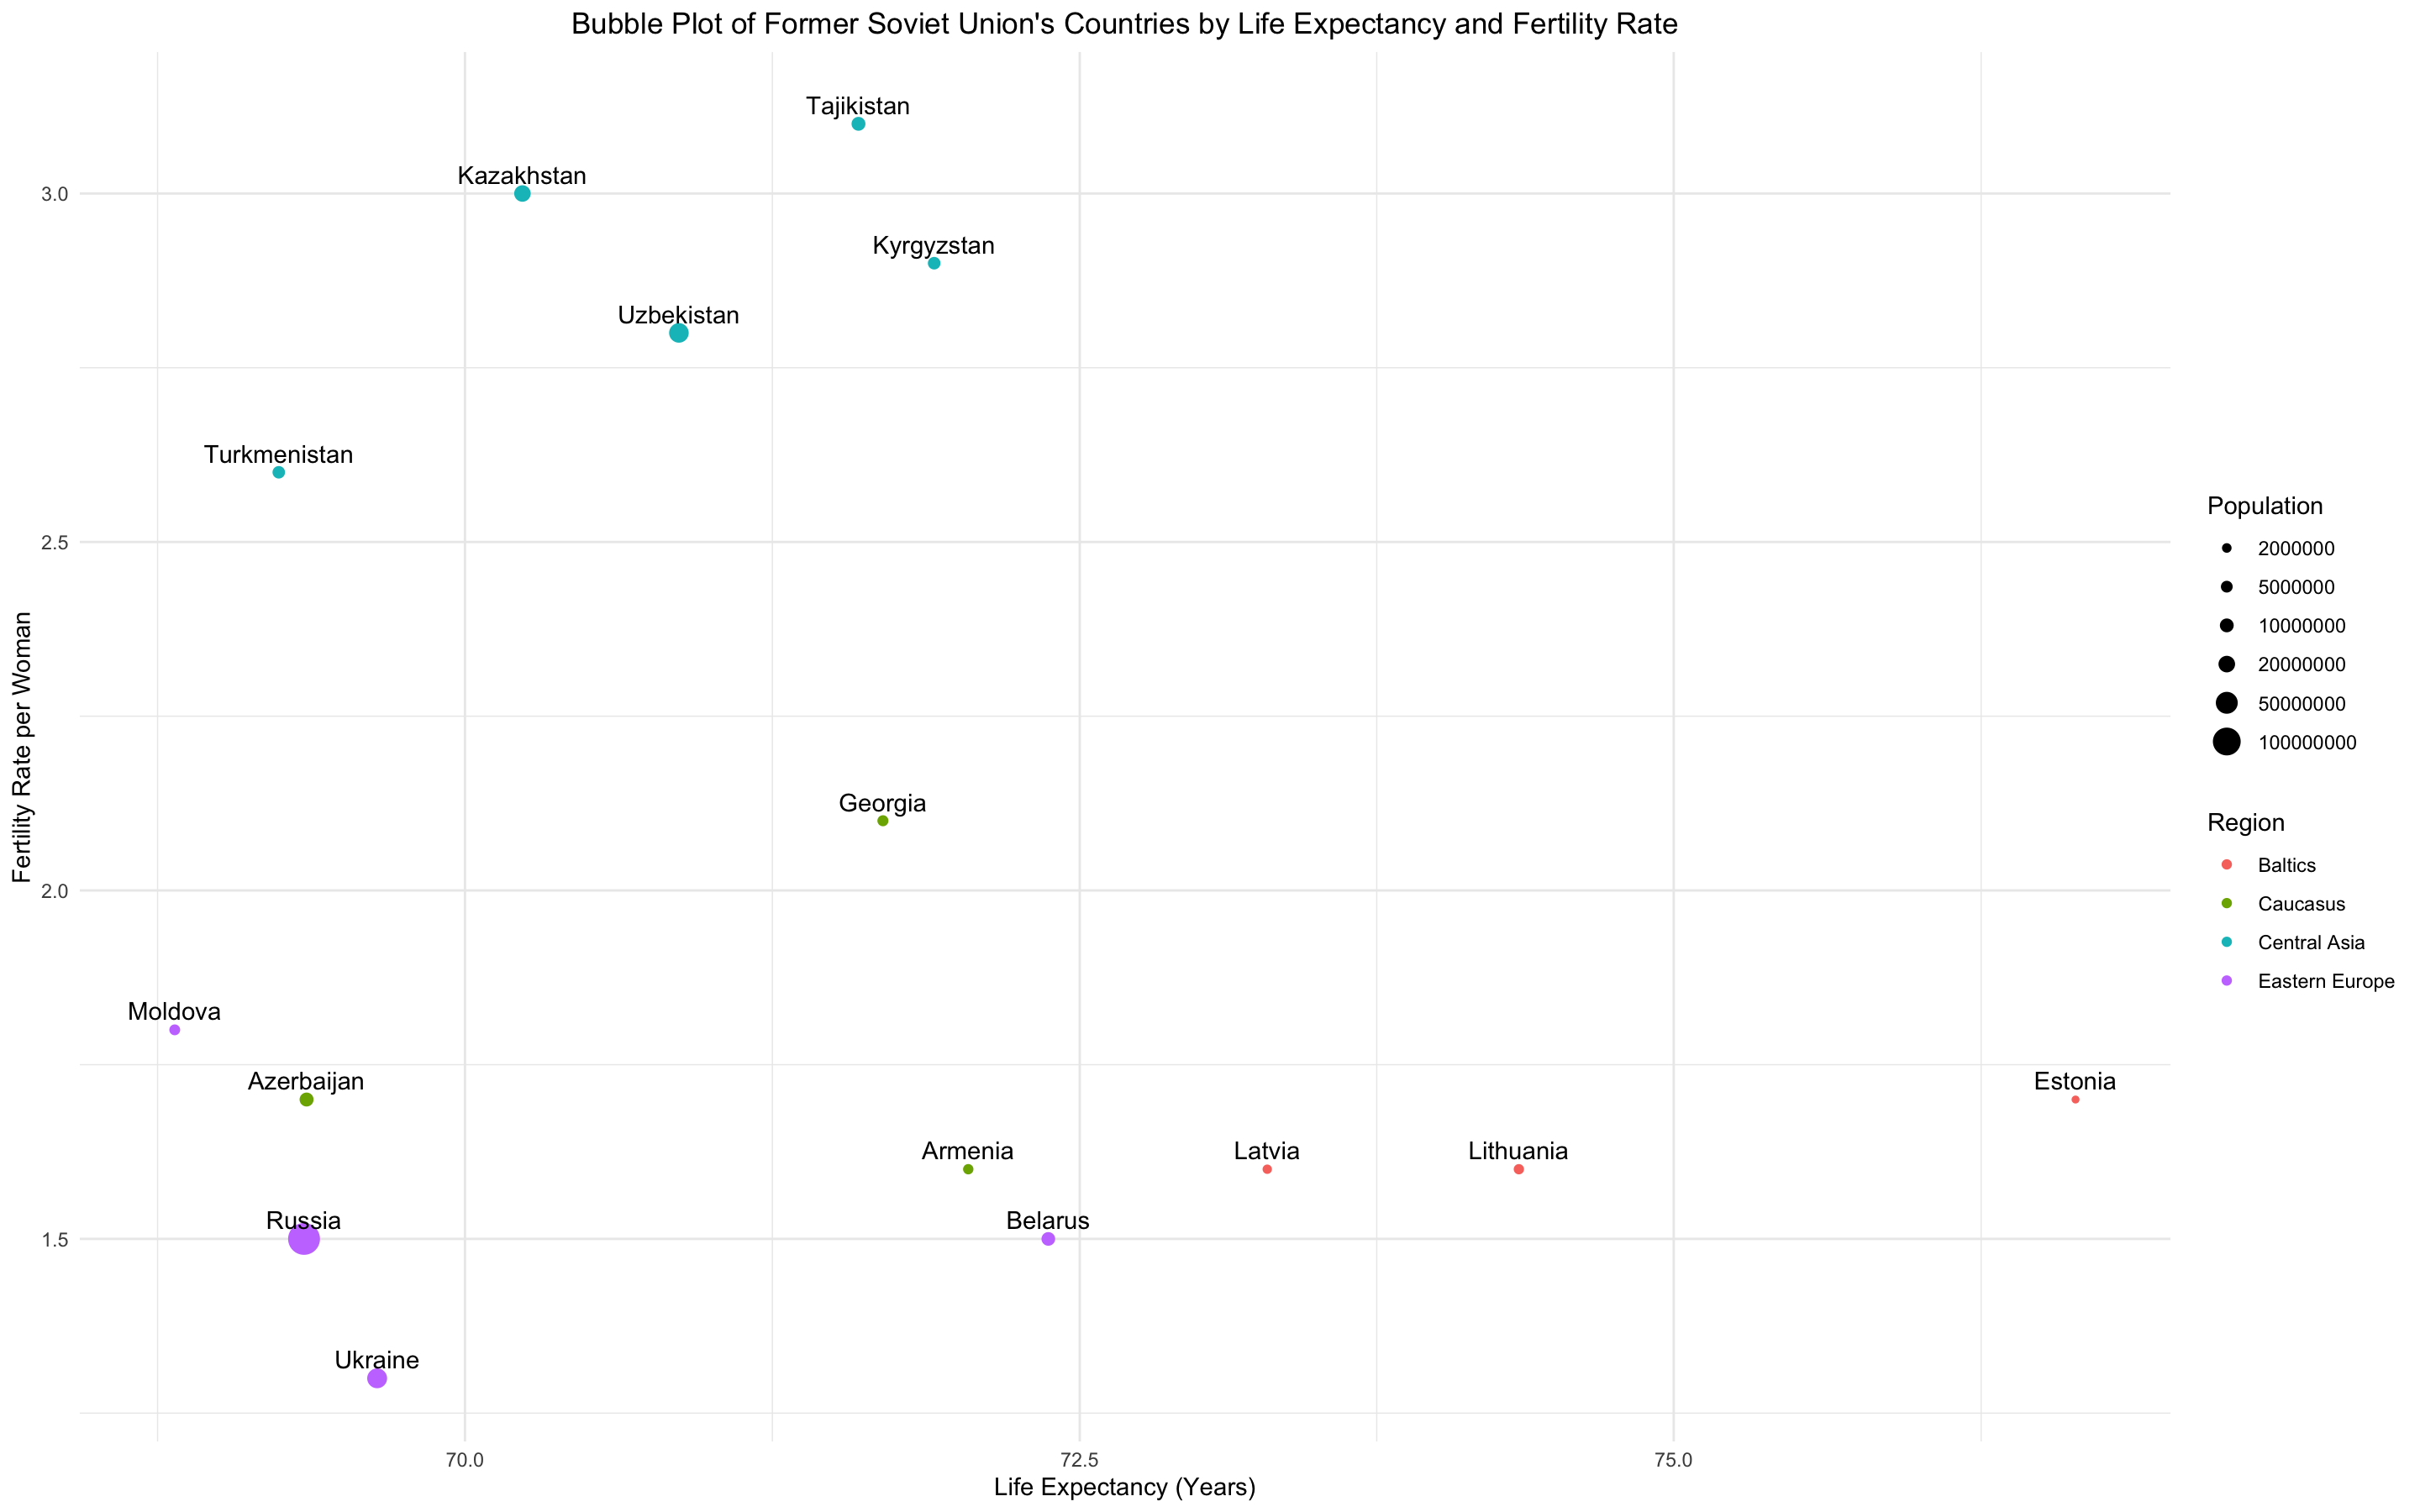
Looking at this bubble plot, you may notice that there is no linear relationship between income and life expectancy in Russia. The reason is due to some regions: for example, Causasian regions show high life expectancy at lower incomes whereas Siberian, Ural and Far Eastern regions experience opposite situation with higher incomes and lower life expectancies. When reducing these regions from our data set, we will see ordinary linear relationship where the more regions earn the longer they live.


Call:
lm(formula = `Life Expectancy` ~ Population, data = df.new.rus)

Residuals:
    Min      1Q  Median      3Q     Max
-4.1895 -1.0596 -0.4618  0.5349 11.3026

Coefficients:
             Estimate Std. Error t value Pr(>|t|)
(Intercept) 6.904e+01  3.426e-01 201.535   <2e-16 ***
Population  3.416e-07  1.349e-07   2.533   0.0135 *
---
Signif. codes:  0 ‘***’ 0.001 ‘**’ 0.01 ‘*’ 0.05 ‘.’ 0.1 ‘ ’ 1

Residual standard error: 2.223 on 73 degrees of freedom
Multiple R-squared:  0.0808,	Adjusted R-squared:  0.06821
F-statistic: 6.417 on 1 and 73 DF,  p-value: 0.01345

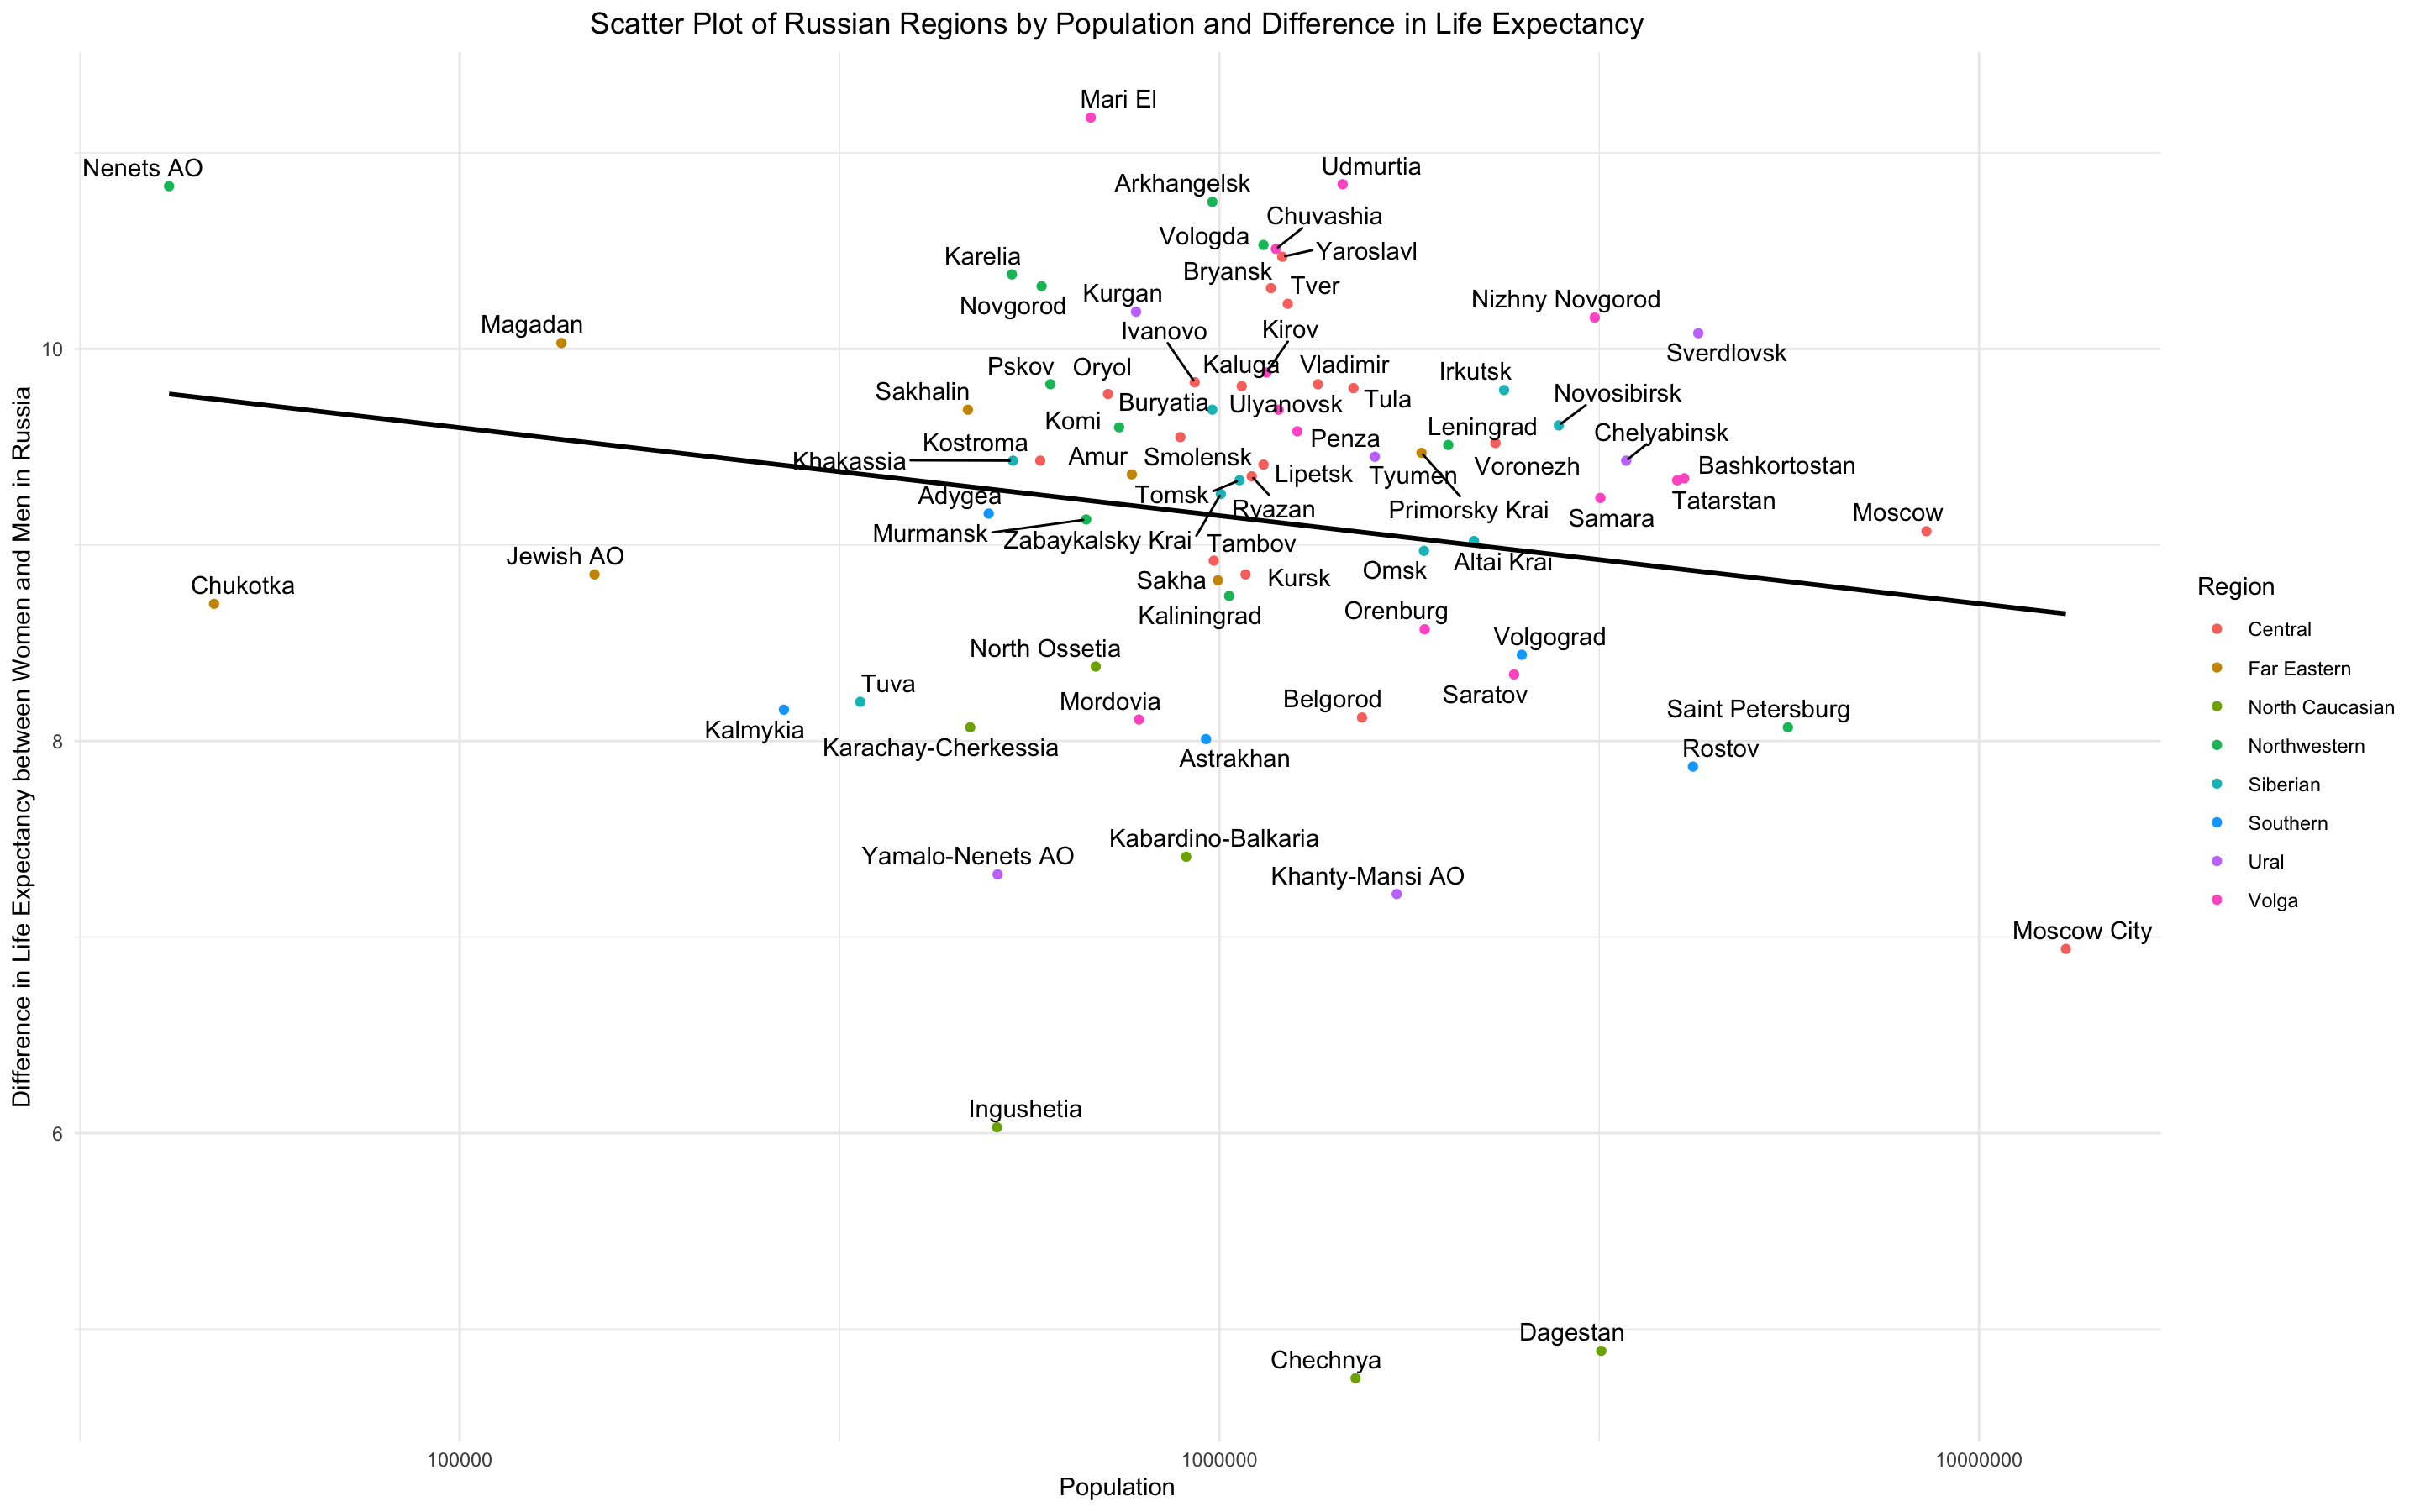
Call:
lm(formula = Difference ~ Population, data = df.new.rus)

Residuals:
    Min      1Q  Median      3Q     Max
-4.4040 -0.5194  0.3089  0.6438  1.9079

Coefficients:
              Estimate Std. Error t value Pr(>|t|)
(Intercept)  9.368e+00  1.822e-01  51.419   <2e-16 ***
Population  -1.416e-07  7.172e-08  -1.974   0.0521 .
---
Signif. codes:  0 ‘***’ 0.001 ‘**’ 0.01 ‘*’ 0.05 ‘.’ 0.1 ‘ ’ 1

Residual standard error: 1.182 on 73 degrees of freedom
Multiple R-squared:  0.05069,	Adjusted R-squared:  0.03769
F-statistic: 3.898 on 1 and 73 DF,  p-value: 0.05213
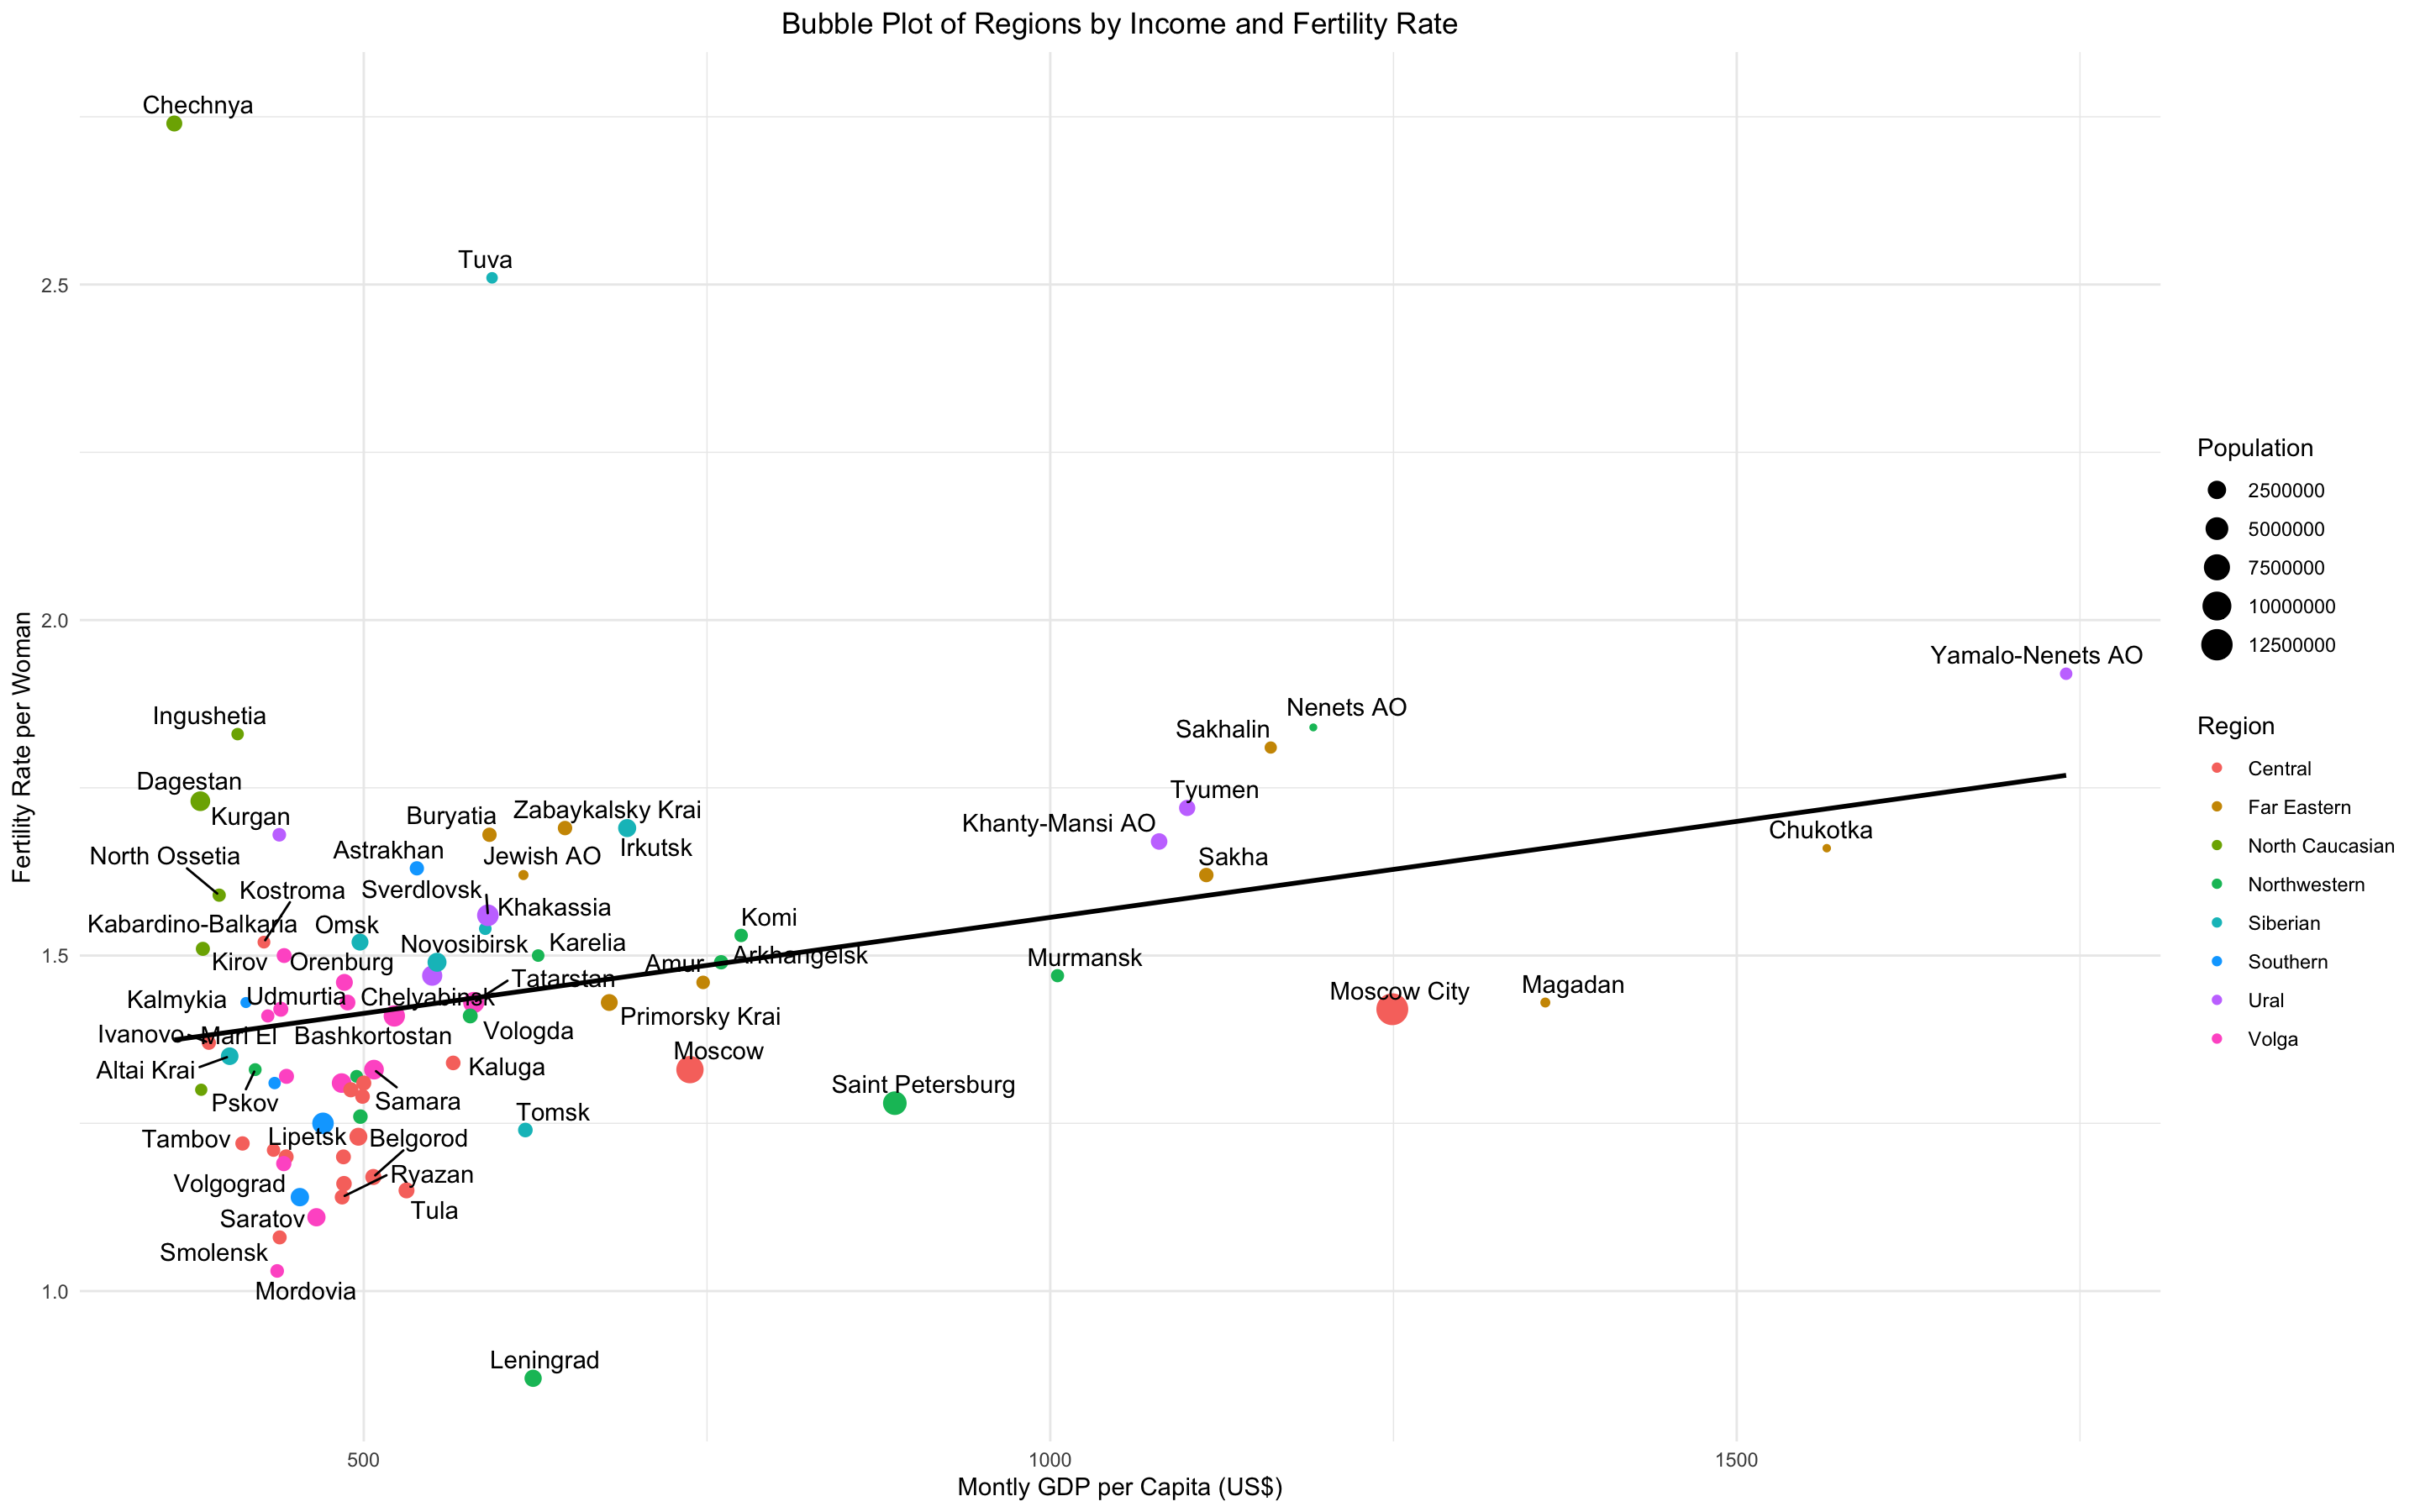
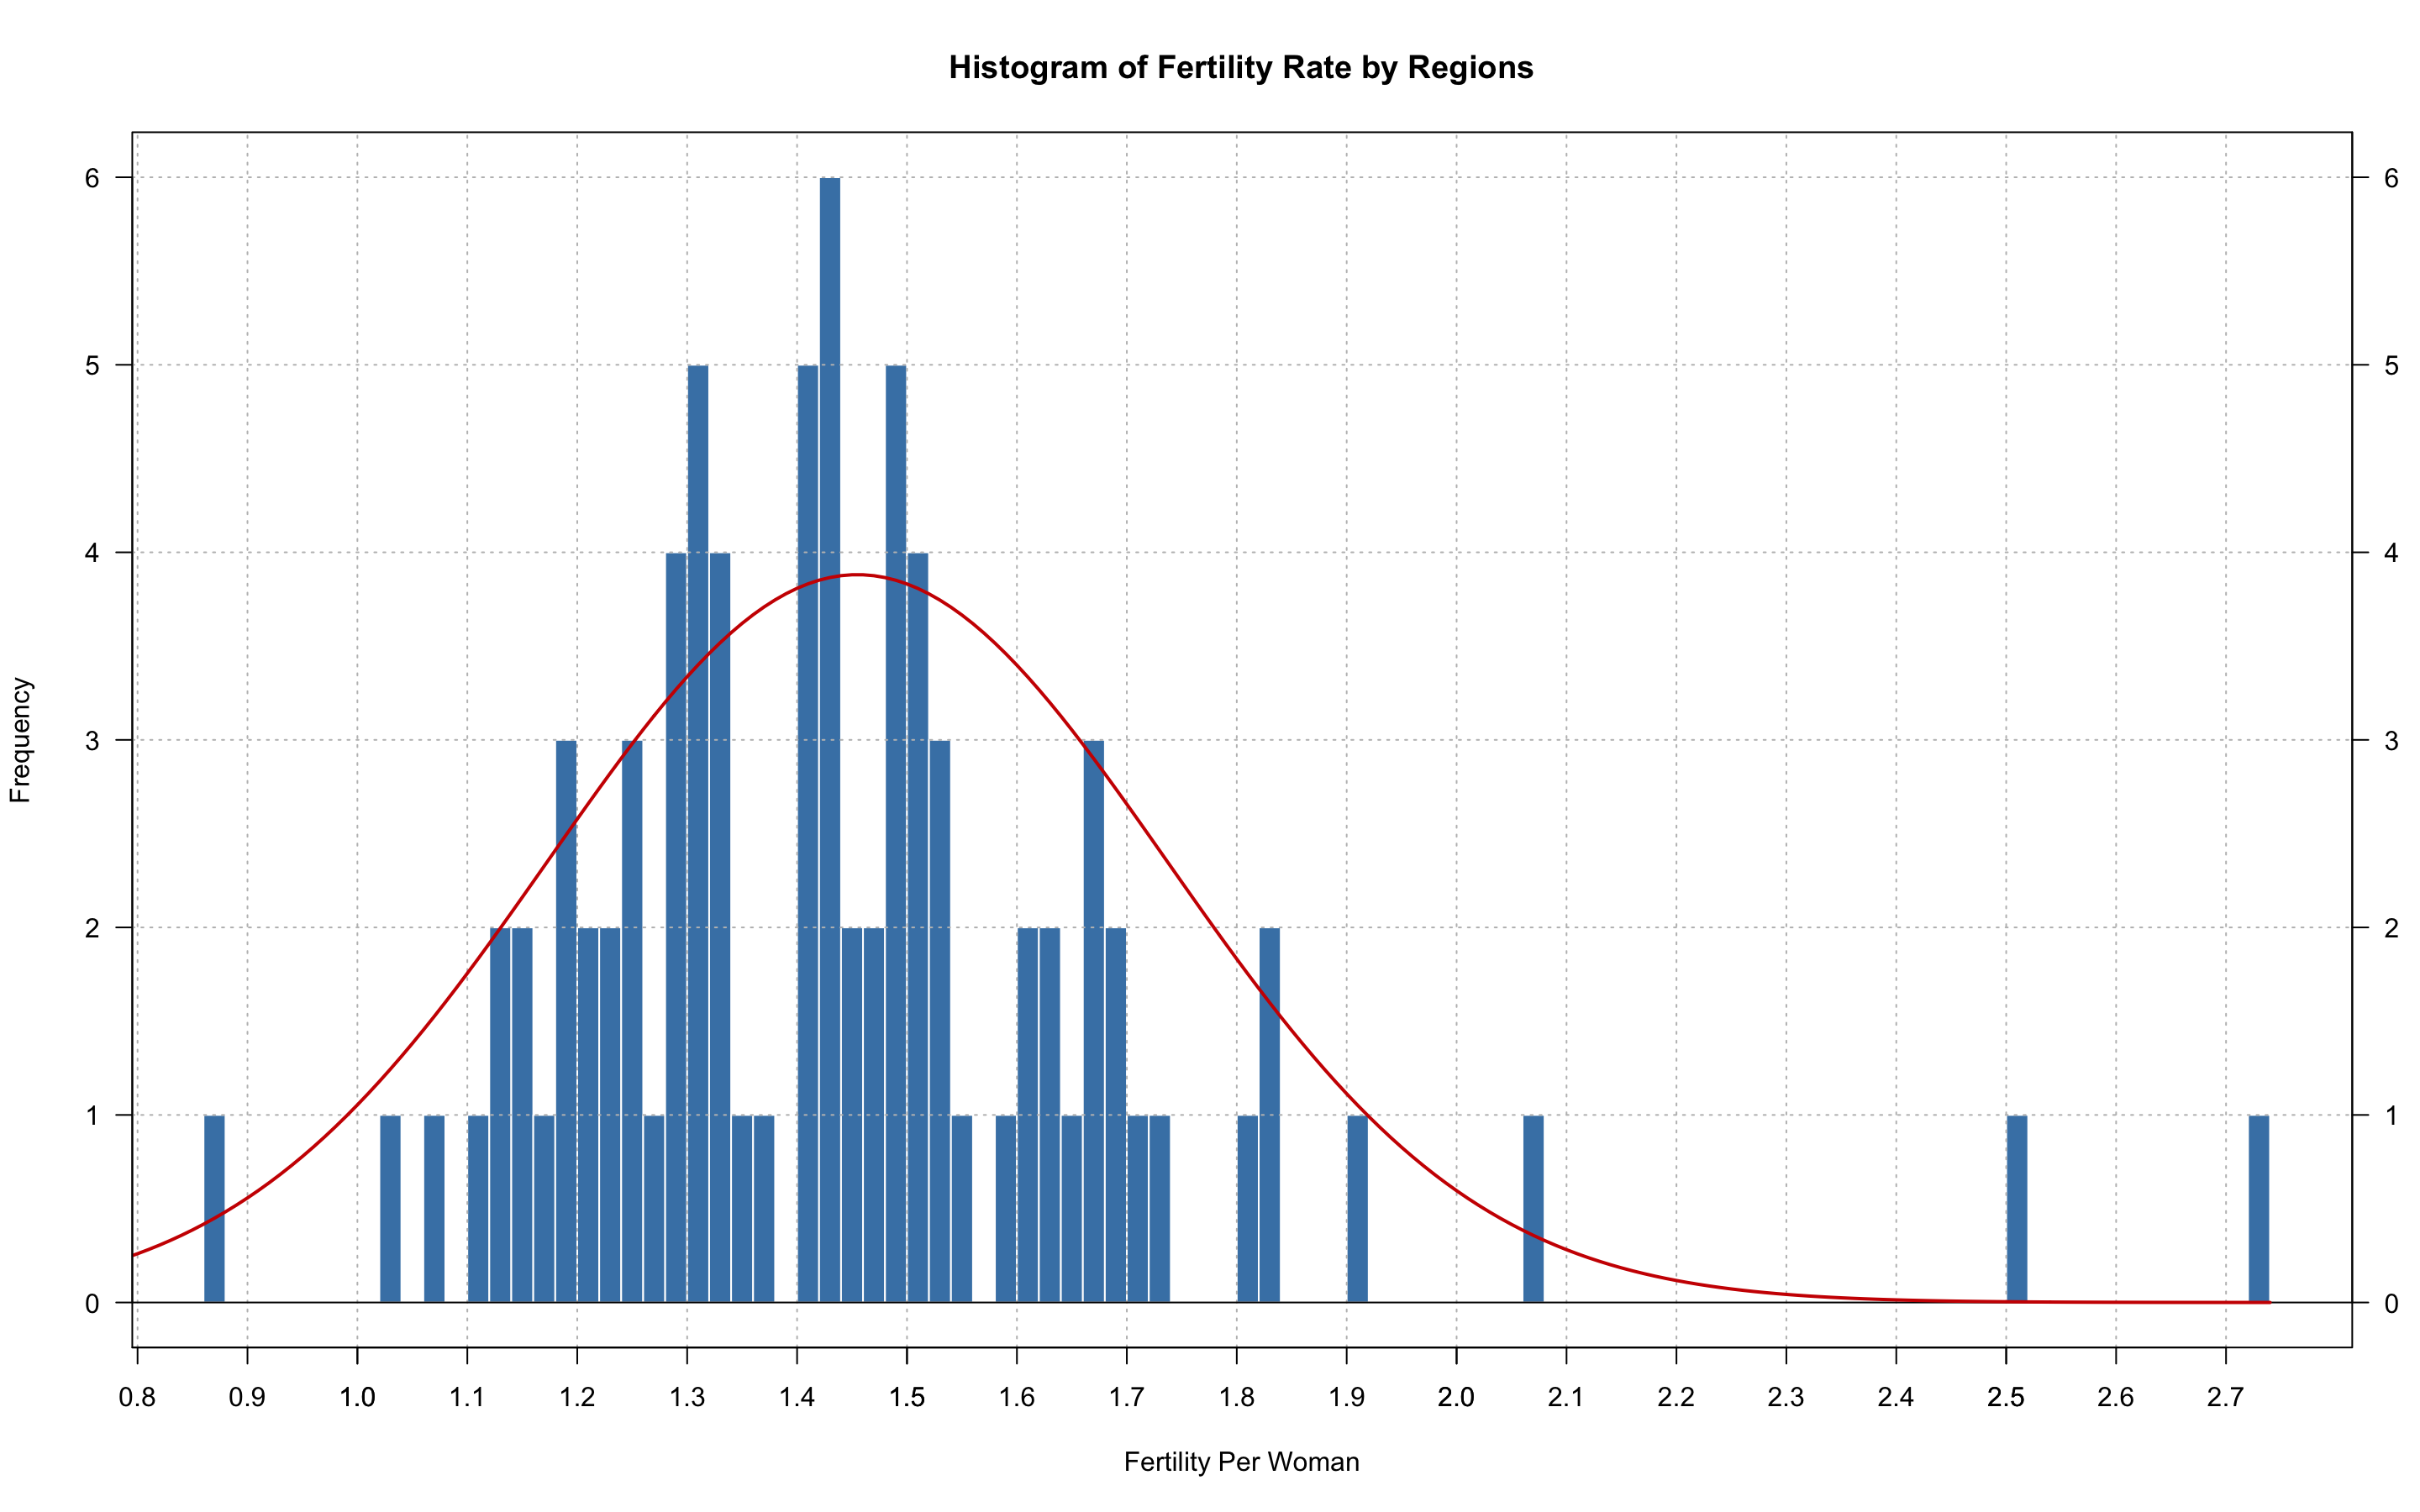
Call:
lm(formula = `Fertility Rate` ~ Income, data = df.new.rus)

Residuals:
     Min       1Q   Median       3Q      Max
-0.57911 -0.16194 -0.02601  0.10487  1.36567

Coefficients:
             Estimate Std. Error t value Pr(>|t|)
(Intercept) 1.2707604  0.0759405  16.734   <2e-16 ***
Income      0.0002861  0.0001121   2.552   0.0128 *
---
Signif. codes:  0 ‘***’ 0.001 ‘**’ 0.01 ‘*’ 0.05 ‘.’ 0.1 ‘ ’ 1

Residual standard error: 0.275 on 73 degrees of freedom
Multiple R-squared:  0.0819,	Adjusted R-squared:  0.06932
F-statistic: 6.512 on 1 and 73 DF,  p-value: 0.01281
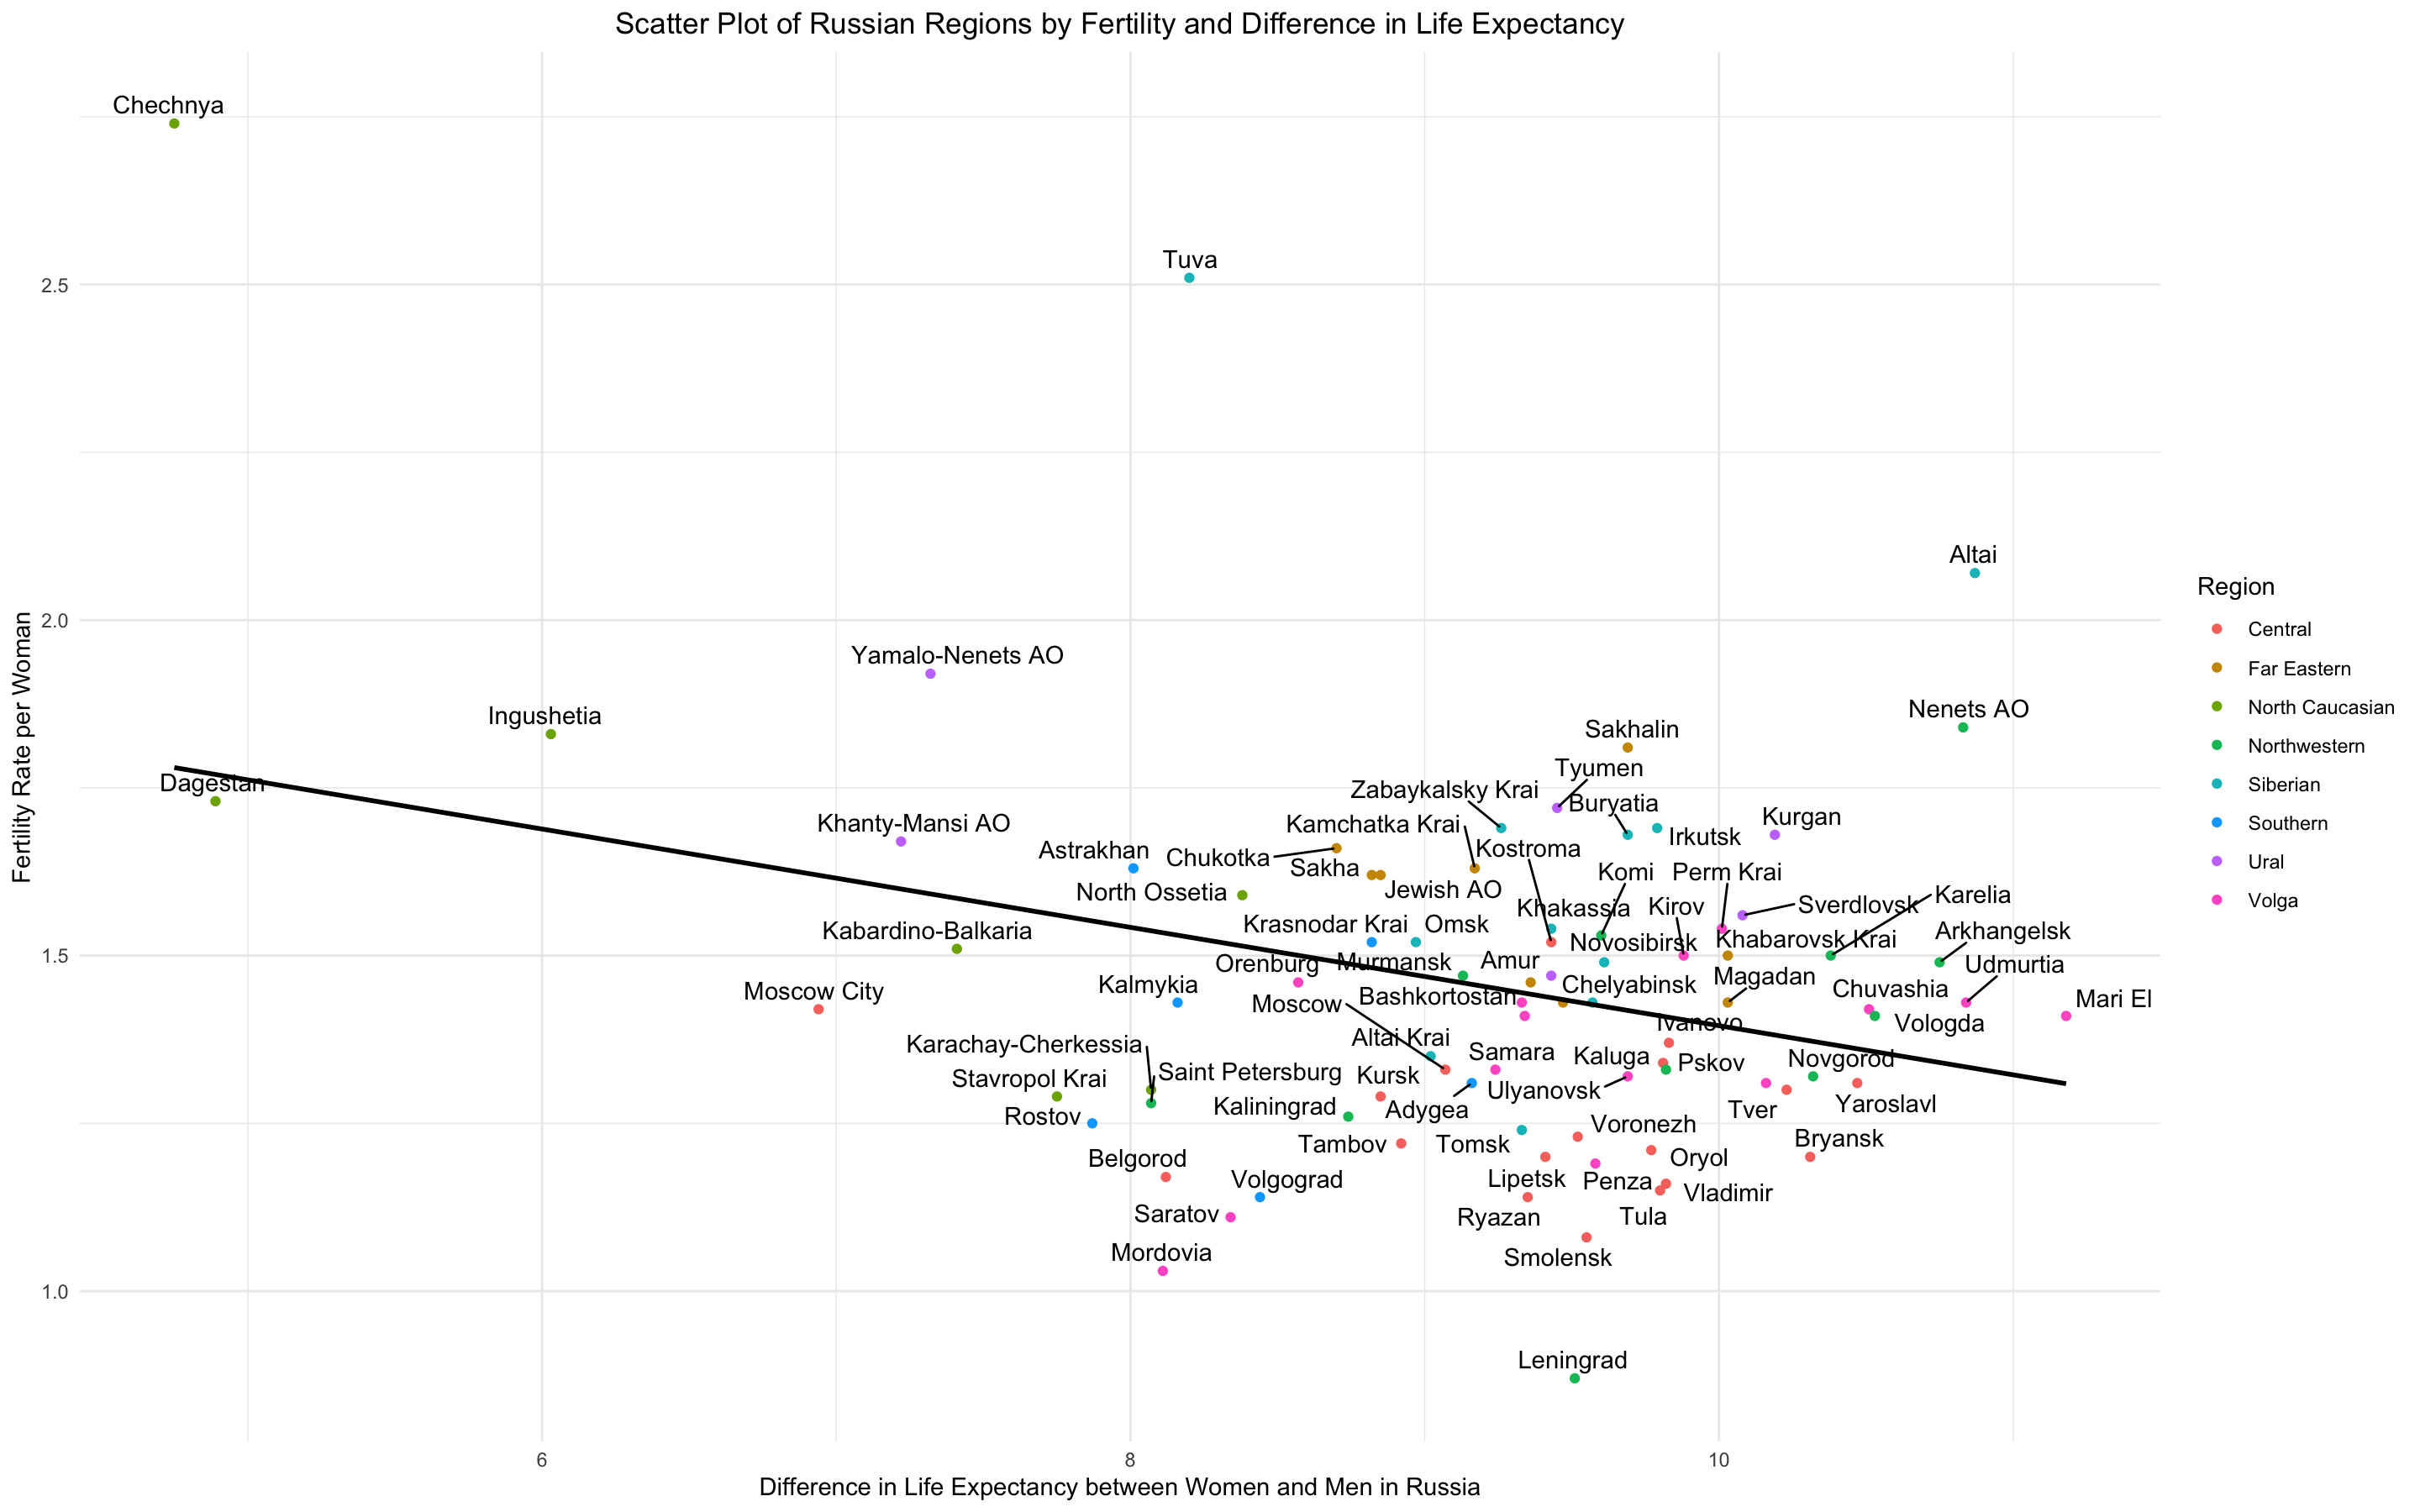
Call:
lm(formula = `Fertility Rate` ~ Difference, data = df.new.rus)

Residuals:
     Min       1Q   Median       3Q      Max
-0.54230 -0.18179 -0.01519  0.12357  0.97884

Coefficients:
            Estimate Std. Error t value Pr(>|t|)
(Intercept)  2.27520    0.23537   9.667 1.06e-14 ***
Difference  -0.09074    0.02556  -3.550 0.000679 ***
---
Signif. codes:  0 ‘***’ 0.001 ‘**’ 0.01 ‘*’ 0.05 ‘.’ 0.1 ‘ ’ 1

Residual standard error: 0.265 on 73 degrees of freedom
Multiple R-squared:  0.1472,	Adjusted R-squared:  0.1355
F-statistic:  12.6 on 1 and 73 DF,  p-value: 0.0006791
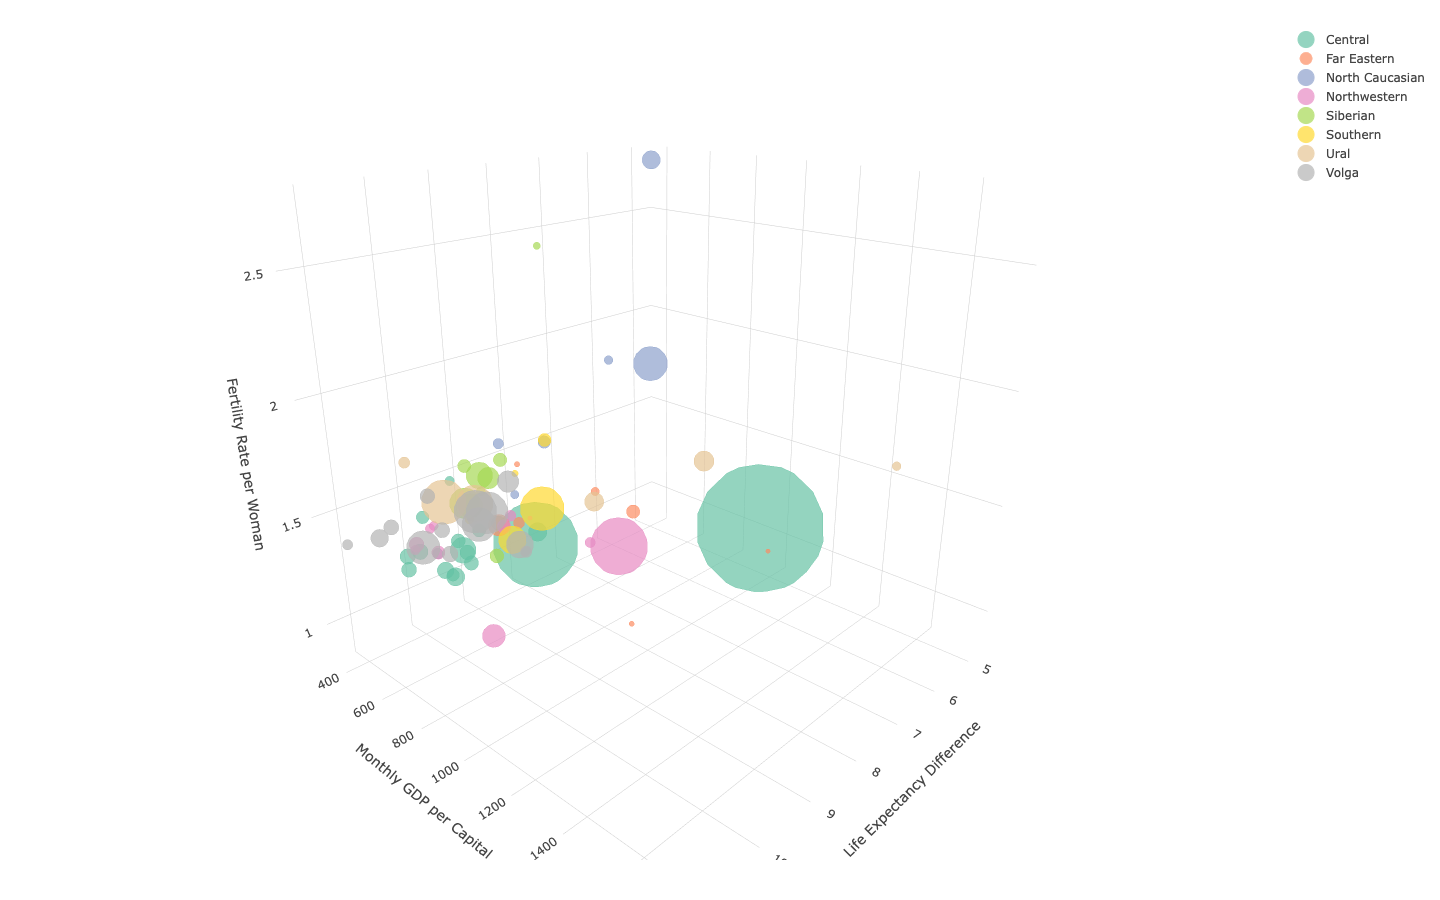
Fig. 26. 3D Bubble Plot of Life Expectnacy Difference between Females, Income and Males and Fertility Rate
Call:
lm(formula = `Fertility Rate` ~ Income + Difference, data = df.new.rus)

Residuals:
     Min       1Q   Median       3Q      Max
-0.54541 -0.15263 -0.00404  0.13997  0.98702

Coefficients:
              Estimate Std. Error t value Pr(>|t|)
(Intercept)  2.0857680  0.2377793   8.772 5.56e-13 ***
Income       0.0002722  0.0001041   2.616 0.010846 *
Difference  -0.0883285  0.0246137  -3.589 0.000603 ***
---
Signif. codes:  0 ‘***’ 0.001 ‘**’ 0.01 ‘*’ 0.05 ‘.’ 0.1 ‘ ’ 1

Residual standard error: 0.255 on 72 degrees of freedom
Multiple R-squared:  0.2212,	Adjusted R-squared:  0.1996
F-statistic: 10.22 on 2 and 72 DF,  p-value: 0.0001234
.png?raw=true)

| Region | Federal District | Fertility Rate | Difference | Income | Life Expectancy | Population |
|---|---|---|---|---|---|---|
| Adygea | Southern | 1.31 | 9.16 | 435.07 | 71.22 | 496934 |
| Altai Krai | Siberian | 1.35 | 9.02 | 402.33 | 68.6 | 2163693 |
| Amur | Far Eastern | 1.46 | 9.36 | 747.16 | 66.3 | 766912 |
| Arkhangelsk | Northwestern | 1.49 | 10.75 | 760.29 | 69.6 | 978873 |
| Astrakhan | Southern | 1.63 | 8.01 | 538.66 | 69.9 | 960142 |
| Bashkortostan | Volga | 1.41 | 9.34 | 522.24 | 69.49 | 4091423 |
| Belgorod | Central | 1.17 | 8.12 | 506.96 | 70.67 | 1540486 |
| Bryansk | Central | 1.2 | 10.31 | 443.45 | 68.67 | 1169161 |
| Buryatia | Siberian | 1.68 | 9.69 | 591.56 | 68.91 | 978588 |
| Chechnya | North Caucasian | 2.74 | 4.75 | 361.99 | 73 | 1510824 |
| Chelyabinsk | Ural | 1.47 | 9.43 | 549.82 | 69.16 | 3431224 |
| Chukotka | Far Eastern | 1.66 | 8.7 | 1565.56 | 64.87 | 47490 |
| Chuvashia | Volga | 1.42 | 10.51 | 439.56 | 69.99 | 1186909 |
| Dagestan | North Caucasian | 1.73 | 4.89 | 380.96 | 76.59 | 3182054 |
| Ingushetia | North Caucasian | 1.83 | 6.03 | 408.11 | 80.52 | 509541 |
| Irkutsk | Siberian | 1.69 | 9.79 | 691.84 | 66.8 | 2370102 |
| Ivanovo | Central | 1.37 | 9.83 | 387.16 | 69.02 | 927828 |
| Jewish AO | Far Eastern | 1.62 | 8.85 | 616.3 | 66.12 | 150453 |
| Kabardino-Balkaria | North Caucasian | 1.51 | 7.41 | 382.8 | 73.77 | 904200 |
| Kaliningrad | Northwestern | 1.26 | 8.74 | 497.54 | 70.99 | 1029966 |
| Kalmykia | Southern | 1.43 | 8.16 | 414.18 | 71.4 | 267133 |
| Kaluga | Central | 1.34 | 9.81 | 565.12 | 69.16 | 1069904 |
| Karachay-Cherkessia | North Caucasian | 1.3 | 8.07 | 381.6 | 73.47 | 469865 |
| Karelia | Northwestern | 1.5 | 10.38 | 627.02 | 67.31 | 533121 |
| Khakassia | Siberian | 1.54 | 9.43 | 588.49 | 68.49 | 534795 |
| Khanty-Mansi AO | Ural | 1.67 | 7.22 | 1079.29 | 72.01 | 1711480 |
| Kirov | Volga | 1.5 | 9.88 | 441.99 | 69.73 | 1153680 |
| Komi | Northwestern | 1.53 | 9.6 | 774.88 | 68.32 | 737853 |
| Kostroma | Central | 1.52 | 9.43 | 427.29 | 68.78 | 580976 |
| Kurgan | Ural | 1.68 | 10.19 | 438.46 | 68.29 | 776661 |
| Kursk | Central | 1.29 | 8.85 | 499.09 | 68.56 | 1082458 |
| Leningrad | Northwestern | 0.87 | 9.51 | 623.34 | 70.17 | 2000997 |
| Lipetsk | Central | 1.2 | 9.41 | 485.19 | 68.58 | 1143224 |
| Magadan | Far Eastern | 1.43 | 10.03 | 1360.58 | 67.41 | 136085 |
| Mari El | Volga | 1.41 | 11.18 | 430.09 | 69.46 | 677097 |
| Mordovia | Volga | 1.03 | 8.11 | 436.91 | 70.24 | 783552 |
| Moscow | Central | 1.33 | 9.07 | 737.57 | 70.35 | 8524665 |
| Moscow City | Central | 1.42 | 6.94 | 1249.13 | 74.55 | 13010112 |
| Murmansk | Northwestern | 1.47 | 9.13 | 1005.29 | 68.29 | 667744 |
| Nenets AO | Northwestern | 1.84 | 10.83 | 1191.59 | 69.39 | 41434 |
| Nizhny Novgorod | Volga | 1.31 | 10.16 | 483.85 | 68.93 | 3119115 |
| North Ossetia | North Caucasian | 1.59 | 8.38 | 394.68 | 72.47 | 687357 |
| Novgorod | Northwestern | 1.32 | 10.32 | 494.79 | 67.64 | 583387 |
| Novosibirsk | Siberian | 1.49 | 9.61 | 553.34 | 69.19 | 2797176 |
| Omsk | Siberian | 1.52 | 8.97 | 497.24 | 69.02 | 1858798 |
| Orenburg | Volga | 1.46 | 8.57 | 485.87 | 68.21 | 1862767 |
| Oryol | Central | 1.21 | 9.77 | 434.26 | 68.97 | 713374 |
| Penza | Volga | 1.19 | 9.58 | 441.73 | 69.97 | 1266348 |
| Primorsky Krai | Far Eastern | 1.43 | 9.47 | 678.8 | 68.61 | 1845165 |
| Pskov | Northwestern | 1.33 | 9.82 | 420.9 | 67.69 | 599084 |
| Rostov | Southern | 1.25 | 7.87 | 470.3 | 69.79 | 4200729 |
| Ryazan | Central | 1.14 | 9.35 | 484.23 | 68.61 | 1102810 |
| Saint Petersburg | Northwestern | 1.28 | 8.07 | 886.79 | 72.51 | 5601911 |
| Sakha | Far Eastern | 1.62 | 8.82 | 1113.66 | 69.98 | 995686 |
| Sakhalin | Far Eastern | 1.81 | 9.69 | 1160.59 | 68.42 | 466609 |
| Samara | Volga | 1.33 | 9.24 | 507.43 | 69.33 | 3172925 |
| Saratov | Volga | 1.11 | 8.34 | 465.51 | 69.08 | 2442575 |
| Smolensk | Central | 1.08 | 9.55 | 438.74 | 68 | 888421 |
| Sverdlovsk | Ural | 1.56 | 10.08 | 590.4 | 68.79 | 4268998 |
| Tambov | Central | 1.22 | 8.92 | 411.67 | 69.88 | 982991 |
| Tatarstan | Volga | 1.43 | 9.33 | 580.1 | 71.28 | 4004809 |
| Tomsk | Siberian | 1.24 | 9.33 | 617.69 | 69.7 | 1062666 |
| Tula | Central | 1.15 | 9.8 | 531.12 | 68.97 | 1501214 |
| Tuva | Siberian | 2.51 | 8.2 | 593.44 | 66.88 | 336651 |
| Tver | Central | 1.3 | 10.23 | 490.58 | 67.87 | 1230171 |
| Tyumen | Ural | 1.72 | 9.45 | 1099.71 | 70.14 | 1601940 |
| Udmurtia | Volga | 1.43 | 10.84 | 488.14 | 69.99 | 1452914 |
| Ulyanovsk | Volga | 1.32 | 9.69 | 443.69 | 69.05 | 1196745 |
| Vladimir | Central | 1.16 | 9.82 | 485.58 | 68.11 | 1348134 |
| Volgograd | Southern | 1.14 | 8.44 | 453.44 | 69.96 | 2500781 |
| Vologda | Northwestern | 1.41 | 10.53 | 577.55 | 69.08 | 1142827 |
| Voronezh | Central | 1.23 | 9.52 | 496.07 | 69.49 | 2308792 |
| Yamalo-Nenets AO | Ural | 1.92 | 7.32 | 1739.92 | 71.7 | 510490 |
| Yaroslavl | Central | 1.31 | 10.47 | 499.99 | 69.07 | 1209811 |
| Zabaykalsky Krai | Siberian | 1.69 | 9.26 | 646.57 | 66.82 | 1004125 |