This widget is for Shopify's dashing framework to display graphs of Prometheus monitoring system.
To install this widget in your dashboard, please copy all files from folder src to your dashing installation.
Now your dashboard available at http://<dashing-host>:3030/prometheus.
Insert the HTML code in your erb file like this :
<li data-row="1" data-col="1" data-sizex="2" data-sizey="1">
<div
data-id="scrape_duration_seconds" data-view="Prometheus"
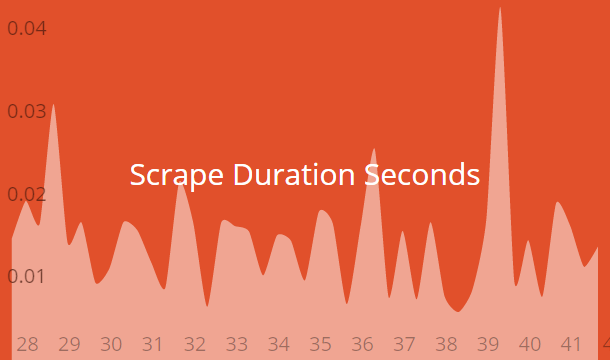
data-title="Scrape Duration Seconds" style="background-color:#E1502B">
</div>
</li>
also you can you Graph as data-view
To configure Prometheus job, you need set host and port in creating, see following code :
prometheus = Prometheus.new(
  {
    :host => 'prometheus',
    :port => 9090
  })
Invoke method query_range required parameters:
query=<string>- Prometheus expression query stringstep=<duration>- Query resolution step width.start=<rfc3339 | unix_timestamp>- Start timestamp.end=<rfc3339 | unix_timestamp>- End timestamp.
prometheus.query_range(
 'scrape_duration_seconds',
 '20s')
And return array of pairs, example: {"x":1234567890,"y":1.23}, where x - timestamp, y - value