This repo contains 2 projects exploring the relationship between economic indicators and results of U.S. Presidential elections from 1976 to 2020, while using using Python, Jupyter Notebook, scikit-learn, pandas, geopandas, numpy, scipy, matplotlib, seaborn.
Note: feature-selection-linear-regression was completed in September 2023, 2020-US-presid-election-by-state-classification was completed in January 2024.
- Data cleaning, data wrangling, creating a custom dataset
- Feature engineering
- Linear Regresssion models
- Feature selection with Lasso Regression
- Logistic Regression models
- Support Vector Machines (with and without kernels)
- Random Forest models
- Gradient Boosting models
- Ensemble learning
- Model explanations: Gini importance, permutation feature importance, LIME.
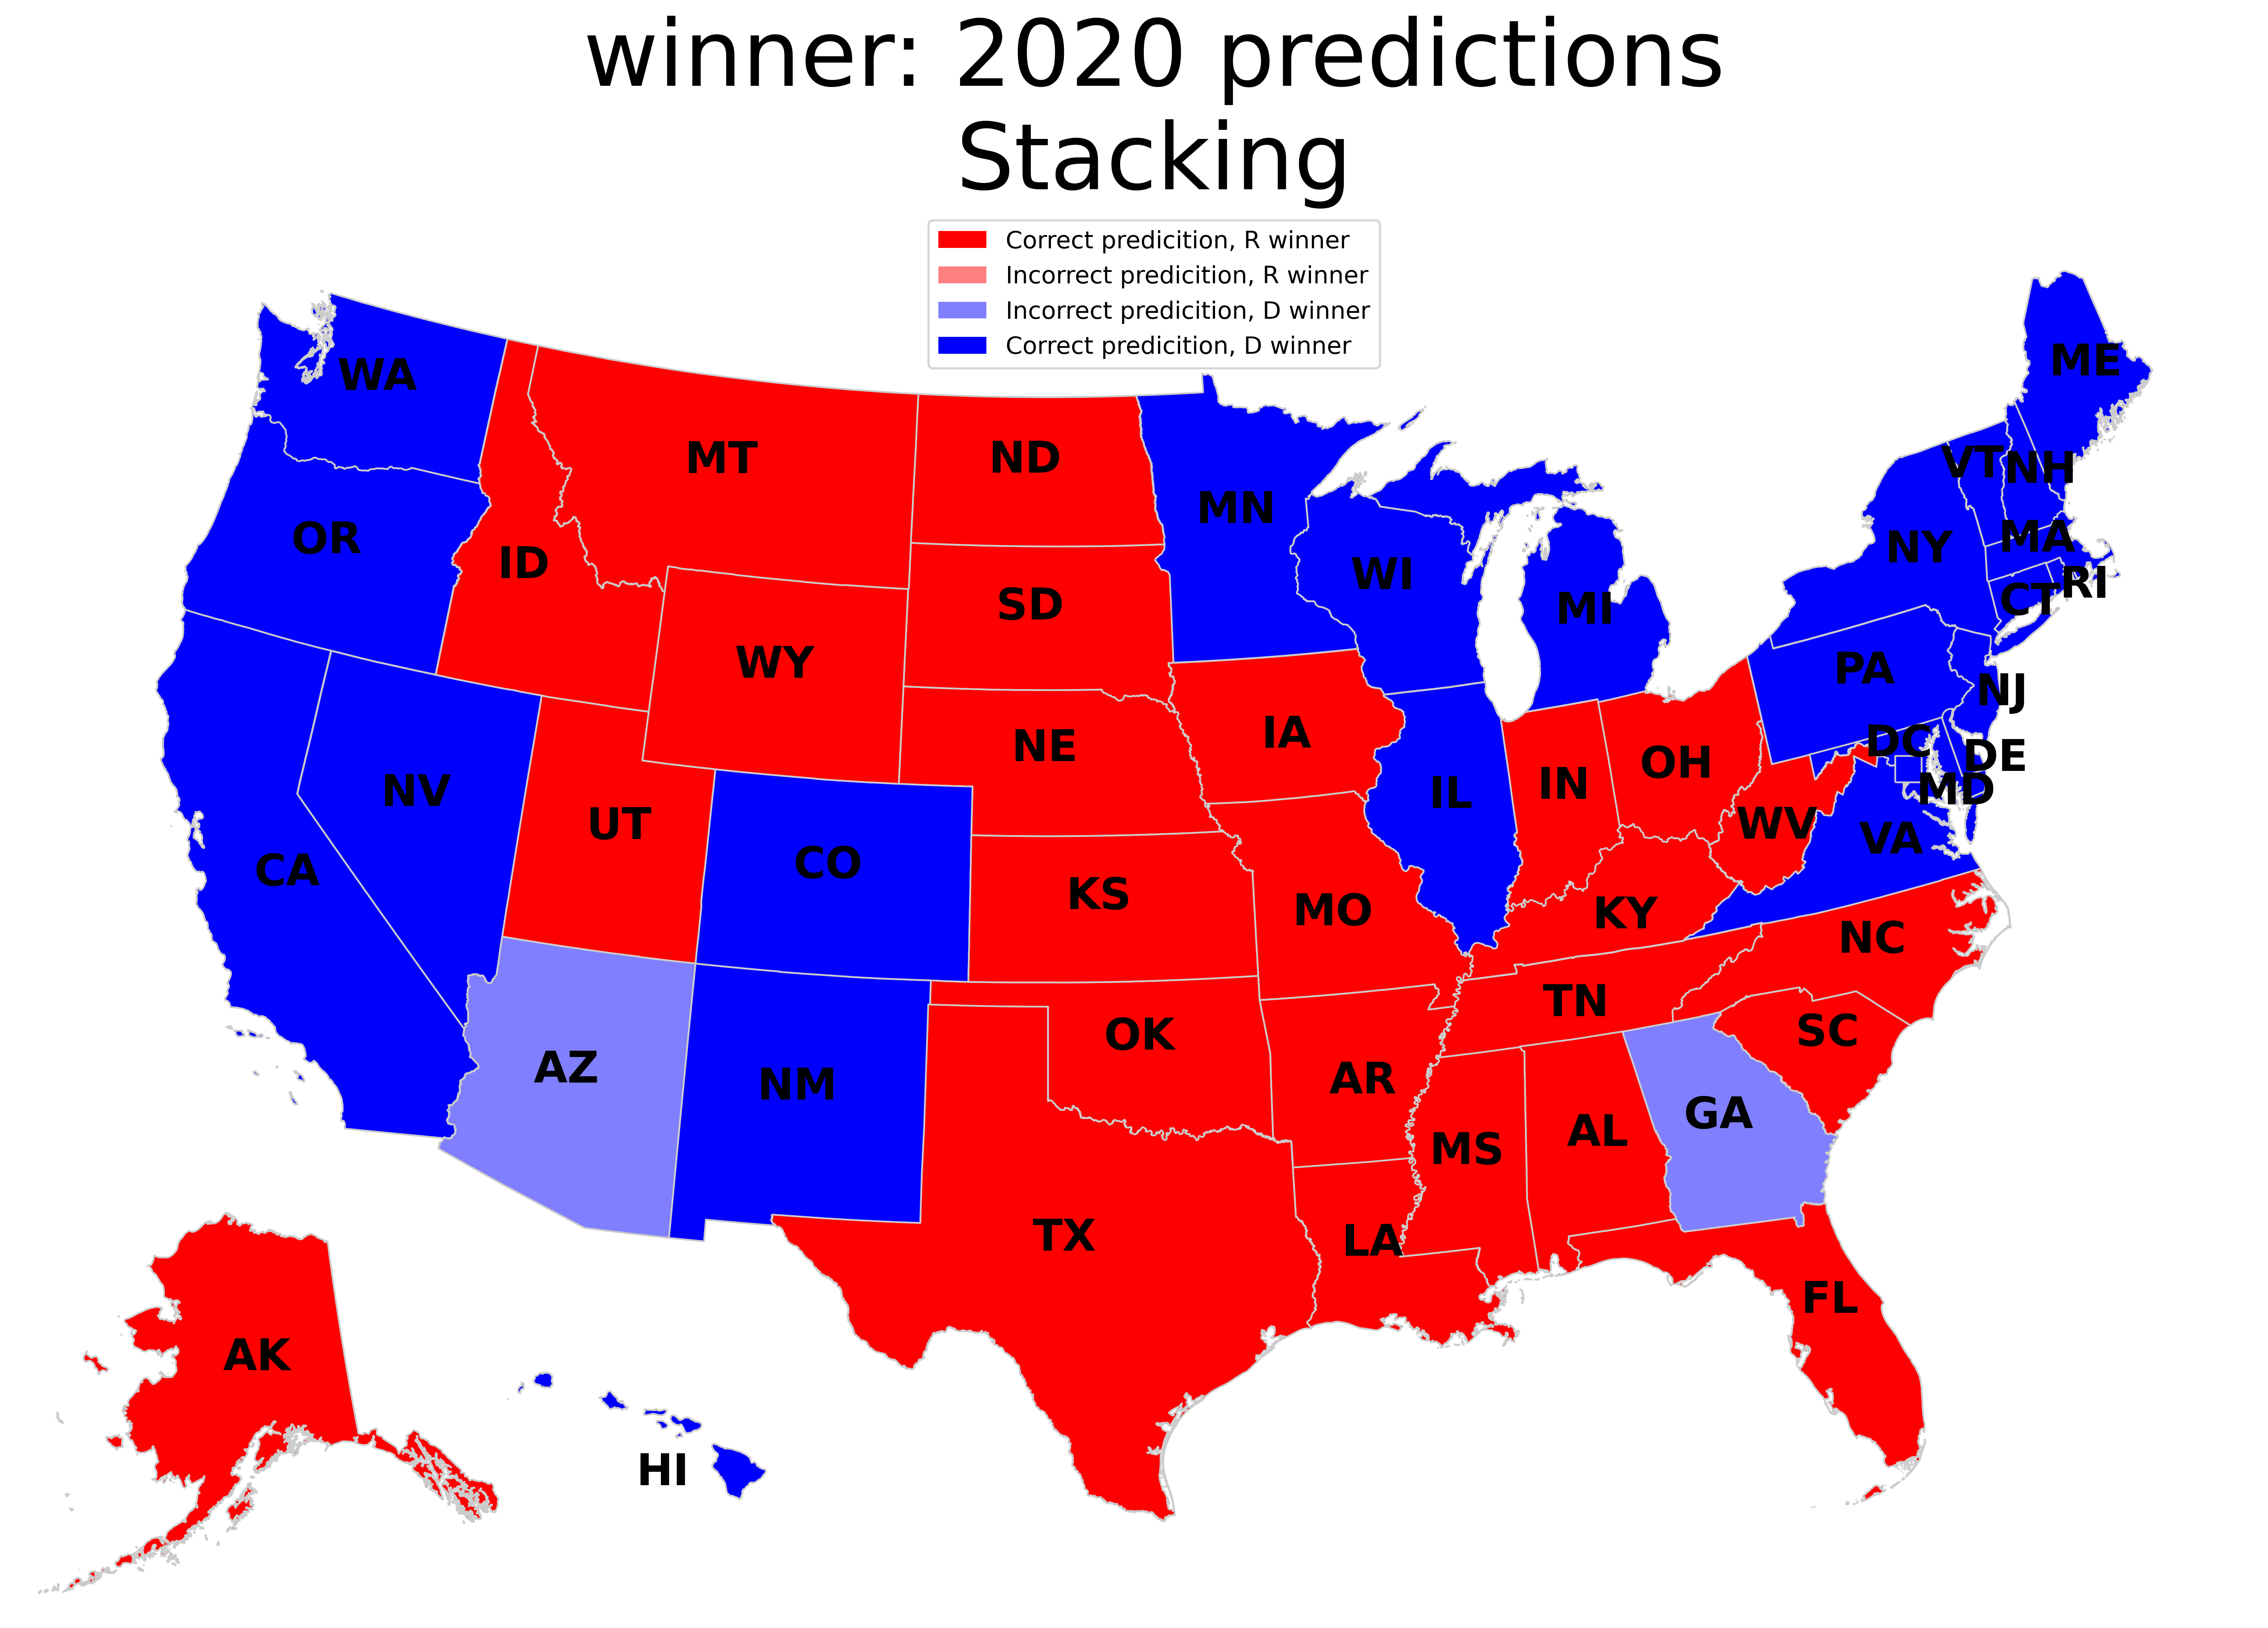
- Choropleths (geographic plots).
- High scores achieved predicting 2020 election results on 1976-2016 data (see below).

- U.S. President 1976–2020 - state-level results of U.S. Presidential electionsin 1976-2020 by MIT Election Data and Science Lab.
- State-level economic data - historical data on employment, income, taxes, benefits etc., by U.S. Bureau of Economic Analysis.