This is a repository of various geo/spatial analysis techniques using Python libraries, chiefly Numpy, Pandas, Shapely, Fiona, Descartes, Matplotlib, and Matplotlib-Basemap.
These tutorials, visualisations, and libraries are an occasional side effect of being embroiled in a PhD at the Bartlett Centre for Advanced Spatial Analysis, at UCL, and teaching on the undergraduate Data Science and Visualisation course.
 .
.
Process TfL tube and rail data, and display it using Mapbox GL JS
 .
.
TfL bike rental travel time isochrone calculation
Airbnb: mapping Airbnb rental data in London
GWR: An introduction to Geographically Weighted Regression using PySAL, using a worked example.
Convert: demonstrates point, choropleth, and hexbin mapping techniques using pandas and Matplotlib Basemap
Convert_Folium: demonstrates the use of the Folium library for creating web-based maps from Python data (pandas) using Leaflet to generate a choropleth map
Router Comparison: analyses route characteristics of journeys from the London Cycle Hire network centroid to 554 stations, calculated using OSRM, Mapzen's new Valhalla router, and the Google Maps Directions API. There's also some outlier identification using RANSAC, and hopefully useful wrappers for route retrieval in helpers.py.
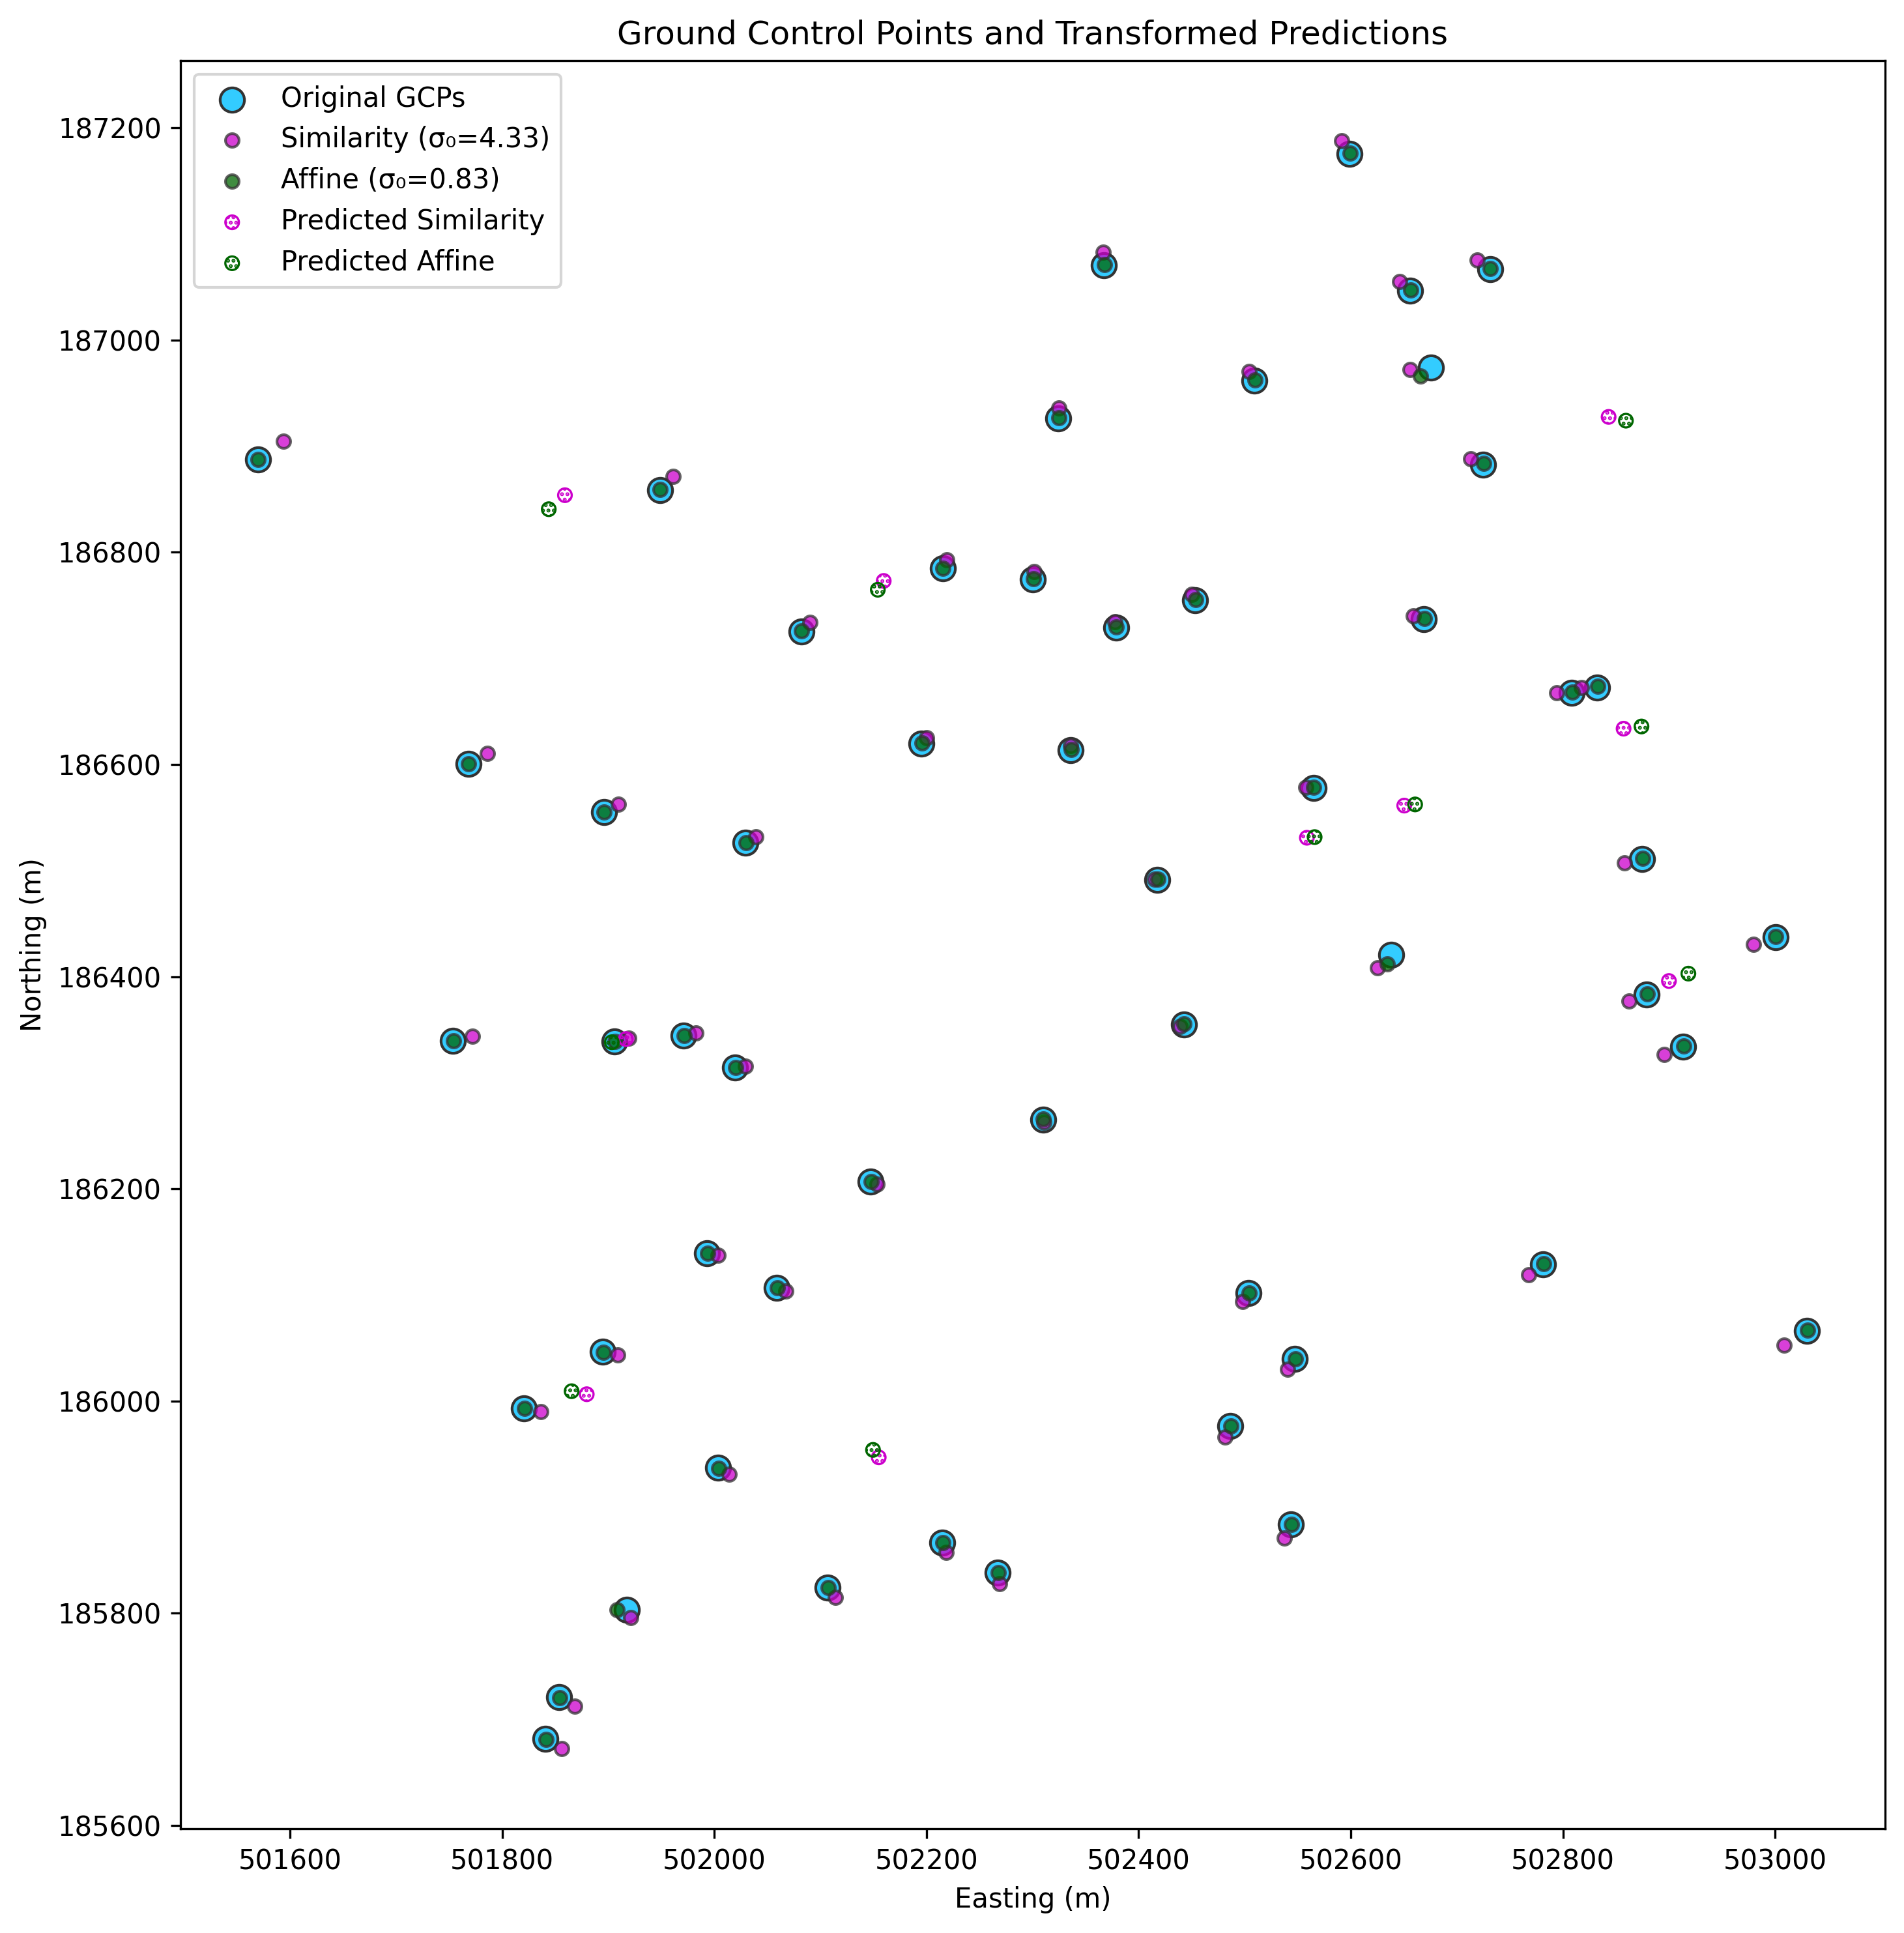
WLS: demonstrates the use of weighted least-squares estimation of similarity and affine transforms to calculate parameters for a transformation matrix which can be used to transform and align coordinates. This approach is useful for e.g. georeferencing raster data, and map feature alignment and correction.
Contour: demonstrates interpolation of irregularly-spaced point data (mean rainfall) into a regular grid, calculating a contour plot, and imposing it onto a basemap (see graphic below). Two approaches for calculating continuous surfaces are then compared – Delaunay Natural Neighbour (matplotlib.griddata), and refinement of a coarse Delaunay mesh using matplotlib.UniformTriRefiner, which uses recursive subdivision and cubic interpolation. High-res images are available in the data folder, all beginning with rainfall_. ☔☔☔
Finally, the map is partitioned into clipped Voronoi cells based on the sensor locations, and some plotting methods (more flexible than scipy.spatial.voronoi2d) are shown.
Bikepath: takes a subset of London bicycle hire stations, creates a DataFrame of all possible origin and destination pairs, and then uses MapZen's wonderful open Valhalla endpoint to get valid bicycle routes between them. These routes are then plotted (it's just the first 400 – there are over 490k origin / destination pairs in total) on a map.
Isochrone: an isochrone is computed for the complete London bike network from an origin at its centroid. Given a network of stations, Single-Source Shortest Path Length, weighted by the travel time between the origin and destinations can be used to generate travel times – though this isn't necessary for a single origin.
Plaques_Geopandas: demonstrates Geopandas and its spatial join functionality, used to create a choropleth.
Circles
Demonstrates drawing circles with correct distortion characteristics on a map (the dot-shaded circle is erroneously non-distorted). The helper library used to plot the circles is available here.
Lonlat-BNG
A demonstration of writing a Rust library, and linking it to Python using FFI, in order to carry out fast Longitude and Latitude to British National Grid transformations, using multithreading. I've blogged about the process here. The Python library is available here.
Pypolyline
A Python library for encoding and decoding Google encoded polylines, using a Rust binary and FFI.
RDP
A Rust implementation of the Ramer–Douglas–Peucker line simplification algorithm. Includes an FFI wrapper.
Polylabel-rs
A Rust implementation of the Mapbox Polylabel algorithm, which determines optimum label placement on a polygon by calculating its pole of inaccessibility. The library has an FFI wrapper, and a sample Python script which demonstrates its use (I know Shapely also includes the algorithm, but it's a pure-Python implementation, and this one is…somewhat faster)
pip install -r requirements.txt or uv pip install -r requirements.txt. The use of a virtualenv is advised.
The Rust libraries (though not their Python counterparts) require a Rust installation. For most platforms (macOS, Windows, *nix), using rustup.rs is the easiest way to install and update a Rust installation.
© Stephan Hügel 2017 - 2025
Unless otherwise specified, the wards.geojson file and any UK shapefiles are provided under Crown Copyright, and their use must be acknowledged in any output by reproducing the following notice:
Contains Ordnance Survey data © Crown copyright and database right 2015
Unless otherwise specified, all other files are provided under the Creative Commons Attribution-NonCommercial-ShareAlike 4.0 International license.


