
Pywedge is a pip installable Python package that intends to,
-
Make multiple interactive charts in a single line of code, to enable the user to quickly read through the charts and can make informed choices in pre-processing steps
-
Interactively preprocess the data by taking the user’s preferred choice of pre-processing techniques,
-
Make a baseline model summary, which can return ten various baseline models & predict the standout test data from selected baseline model.
-
Interactively select hyperparameters in a widget style tab, track the hyperparameters using MLFlow & predict on standout data.
Pywedge intends to help the user by quickly making charts, preprocessing the data and to rightly point out the best performing baseline model for the given dataset so that the user can spend quality time tuning such a model algorithm.
pip install pywedge --upgrade
For JupyterLab, please run the following commands in anaconda prompt to enable required JupyterLab extensions to display interactive chart widget,
conda install -c conda-forge nodejs

jupyter labextension install @jupyter-widgets/jupyterlab-manager

jupyter labextension install [email protected]

jupyter labextension install @jupyter-widgets/jupyterlab-manager [email protected]
Mlflow is not a hard requirement in Pywedge, this is mainly to keep the pywedge light weight for the benefit of trying pywedge in web apps like Heroku. So mlflow has to be separately installed to track the hyperparameters,
pip install mlflow
Cleans the raw data frame to fed into ML models. Following data pre_processing will be carried out,
- Makes 8 different types of interactive charts with interactive axis selection widgets
- Interactive pre-processing & 10 different baseline models
- Missing values imputation for numeric & categorical columns
- Standardization
- Feature importance
- Class oversampling using SMOTE
- Computes 10 different baseline models
- Interactive Hyperparameter tuning & tracking hyperparameters using integreted MLFlow
-
Classification / Regression Hyperparameters tuning
- Available baseline estimators for interactive hyperparameter tuning as of now, more baseline estimators will be added soon for interactive hyperparameter tunings
Classification Regression Logistic Regression Linear Regression Decision Tree Classifier Decision Tree Regressor Random Forest Classifier Random Forest Regressor AdaBoost Classifier AdaBoost Regressor ExtraTrees Classifier ExtraTrees Regressor KNN Classifier KNN Regressor
-
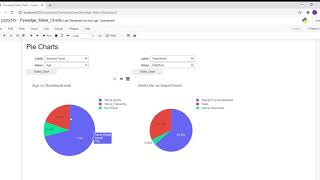
Makes 8 different types of interactive Charts with interactive axis selection widgets in a single line of code for the given dataset.
Different types of Charts viz,
- Scatter Plot
- Pie Chart
- Bar Plot
- Violin Plot
- Box Plot
- Distribution Plot
- Histogram
- Correlation Plot
Arguments:
- Dataframe
- c = any redundant column to be removed (like ID column etc., at present supports a single column removal, subsequent version will provision multiple column removal requirements)
- y = target column name as a string
Returns:
Charts widget
Pywedge-Make_Charts Demo YouTube link below,
Please read about Pywedge-Make_Charts module in this article published in Analytics India Magazine.
The baseline_model class starts with interactive pre-processing steps,
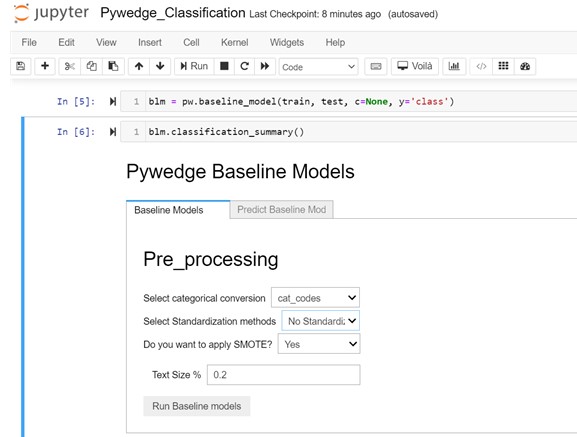
Instantiate the baseline class & call the classification_summary method from baseline_model class,
blm = pw.baseline_model(train, test, c, y, type)
blm.classification_summary()
Args:
- train = train dataframe
- test = test dataframe
- c = any redundant column to be removed (like ID column etc., at present supports a single column removal, subsequent version will provision multiple column removal requirements)
- y = target column name as a string
- type = Classification(Default) / Regression
- For classification - classification_summary()
- For Regression - Regression_summary()
User Inputs:
- Categorical columns conversion options
- Using Pandas Catcodes
- Using Pandas Get Dummies
- Standardization Options,
- Standard scalar
- Minmax scalar
- Robust Scalar
- No Standardization
- For Classification, Class balance using SMOTE options
- Yes
- No
- Test Size for Train-test split
- test size in float
Returns:
- Baseline models tab - Various baseline model metrics
- Predict Baseline model tab - User can select the preferred available baseline choices to predict
- Introducing interactive hyperparameter tuning classes, Pywedge_HP, which has following two methods,
- HP_Tune_Classification
- HP_Tune_Regression
Instantiate the Pywedge_HP class & call the HP_Tune_CLassification method from Pywedge_HP class,
pph = pw.Pywedge_HP(train, test, c, y, tracking=False)
pph.HP_Tune_Classification()
Args:
- train = train dataframe
- test = test dataframe
- c = any redundant column to be removed (like ID column etc., at present supports a single column removal, subsequent version will provision multiple column removal requirements)
- y = target column name as a string
- tracking = True/False(Default) #to enable mlflow hyperpameter tracking
- For classification - HP_Tune_Classification()
- For Regression - HP_Tune_Regression()
As seen in the above GIF, user can interactively enter hyperparameter values, without worrying about tracking the same, as the integreted MLFlow automatically takes care of tracking hyperparameter values.
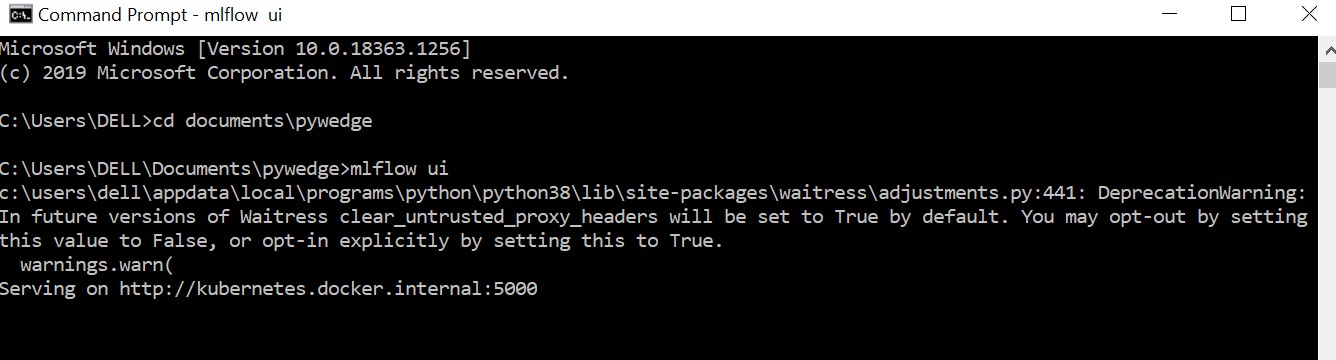
To invoke mlflow tracking user interface, follow the below steps,
- open command prompt
- change directory to the location of the Jupyter Notebook file, for eg., if Jupyter notebook in a folder named pywedge in Documents folder,
cd documents\pywedge - enter the following command from the same folder as of the Jupyter Notebook file,
mlflow ui - which trigers the mlflow ui & typically mlflow starts in the local host 5000. Please find the below pic for reference,
Regression Hyperparameter tuning is in the same lines of above steps.
- A separate method to produce good charts
- To handle NLP column
- To handle time series dataset
- To handle stock prices specific analysis
Requires Python 64 bit
THIS IS IN BETA VERSION