-
Notifications
You must be signed in to change notification settings - Fork 49
Developer coupling analysis
Dependencies (explicit or implict) formed at code level often reflect in dependencies formed in domain and/or technical knowledge. In other words the logical coupling between different modules/parts of a codebase may cause a certain degree of coupling between the main developers who write and maintain those modules. The purpose of this analysis is to determine how strong those dependencies may be as well as to help understanding whether they are aligned or not to the organisational structure of our teams.
This task allows us to look for potential dependencies between developers starting from two separate reports:
- The indirect coupling between modules and the corresponding main developers behind them
- The direct coupling between developers sharing commits on the same piece of code
$ gulp developer-coupling-analysis [--dateFrom=<dateFrom>] [--dateTo=<dateTo>] [--maxCoupledFiles=<maxCoupledFiles>]- The maxCoupledFiles parameter determines how many coupled files we want to retrieve information for in the first report.
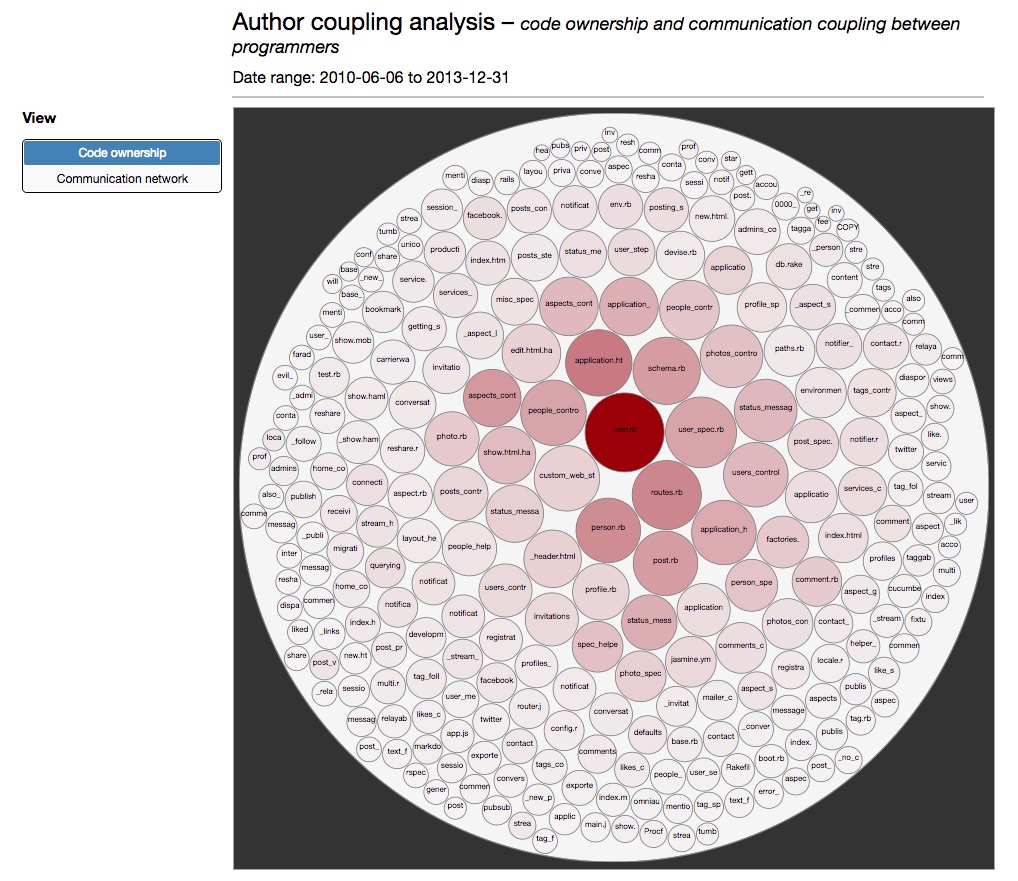
The first report (Code ownership) is graphically laid out as a bubble chart, where each circle represent a module/file. The size of the circle is proportional to the total number of different authors, while the intensity of the red fill is proportional to the total number of revisions.
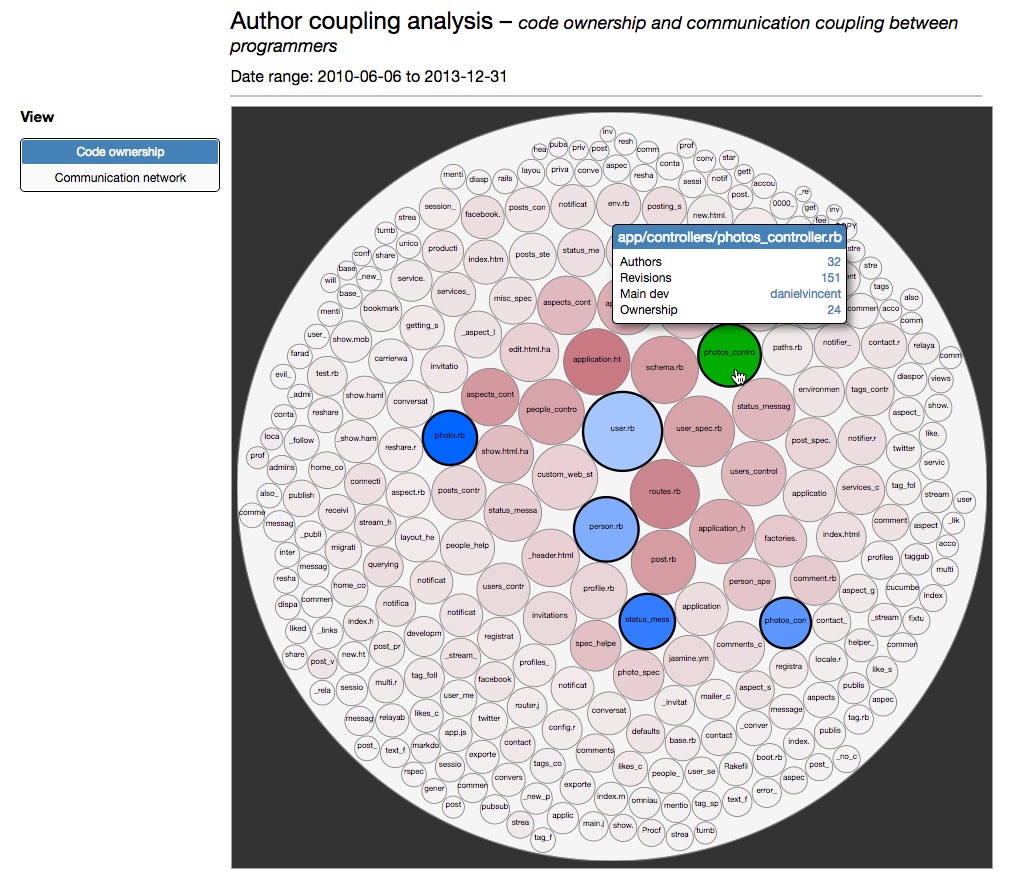
Hovering on a circle will show authors and revisions information as well as the main developer behind the module and the percentage of ownership (as relative number of revisions). Clicking on it will change its colour to green, and at the same time other circles (as many as maxCoupledFiles) will be highlighted in blue colour. Those circles represent modules that are most coupled with the selected one, and the darker the blue colour the higher the degree of coupling.
Again, hovering on either of the blue circles will show main developer and ownership information. This is how we can find possible dependencies between main developers of different modules.
The second report is called Communication network and it's more straightforward to understand. Its visualisation is implemented via a network graph where every developer is represented by a coloured node. If you have provided team information in your contributors configuration settings, each developer node belonging to the same team will have the same colour.
The links between developers reflect the fact that, during the period of time of the analysis, they have worked on the same file, and the higher the number of shared commits the stronger is the coupling between them.
Selecting one developer will highlight all his/her links with other developers, and hovering over any of those will show the coupling information.


