A collection of data visualization projects, primarily made with D3.js.
A heatmap comparing city temperatures across the globe. Temperatures are displayed with colours, a line graph, and a label.
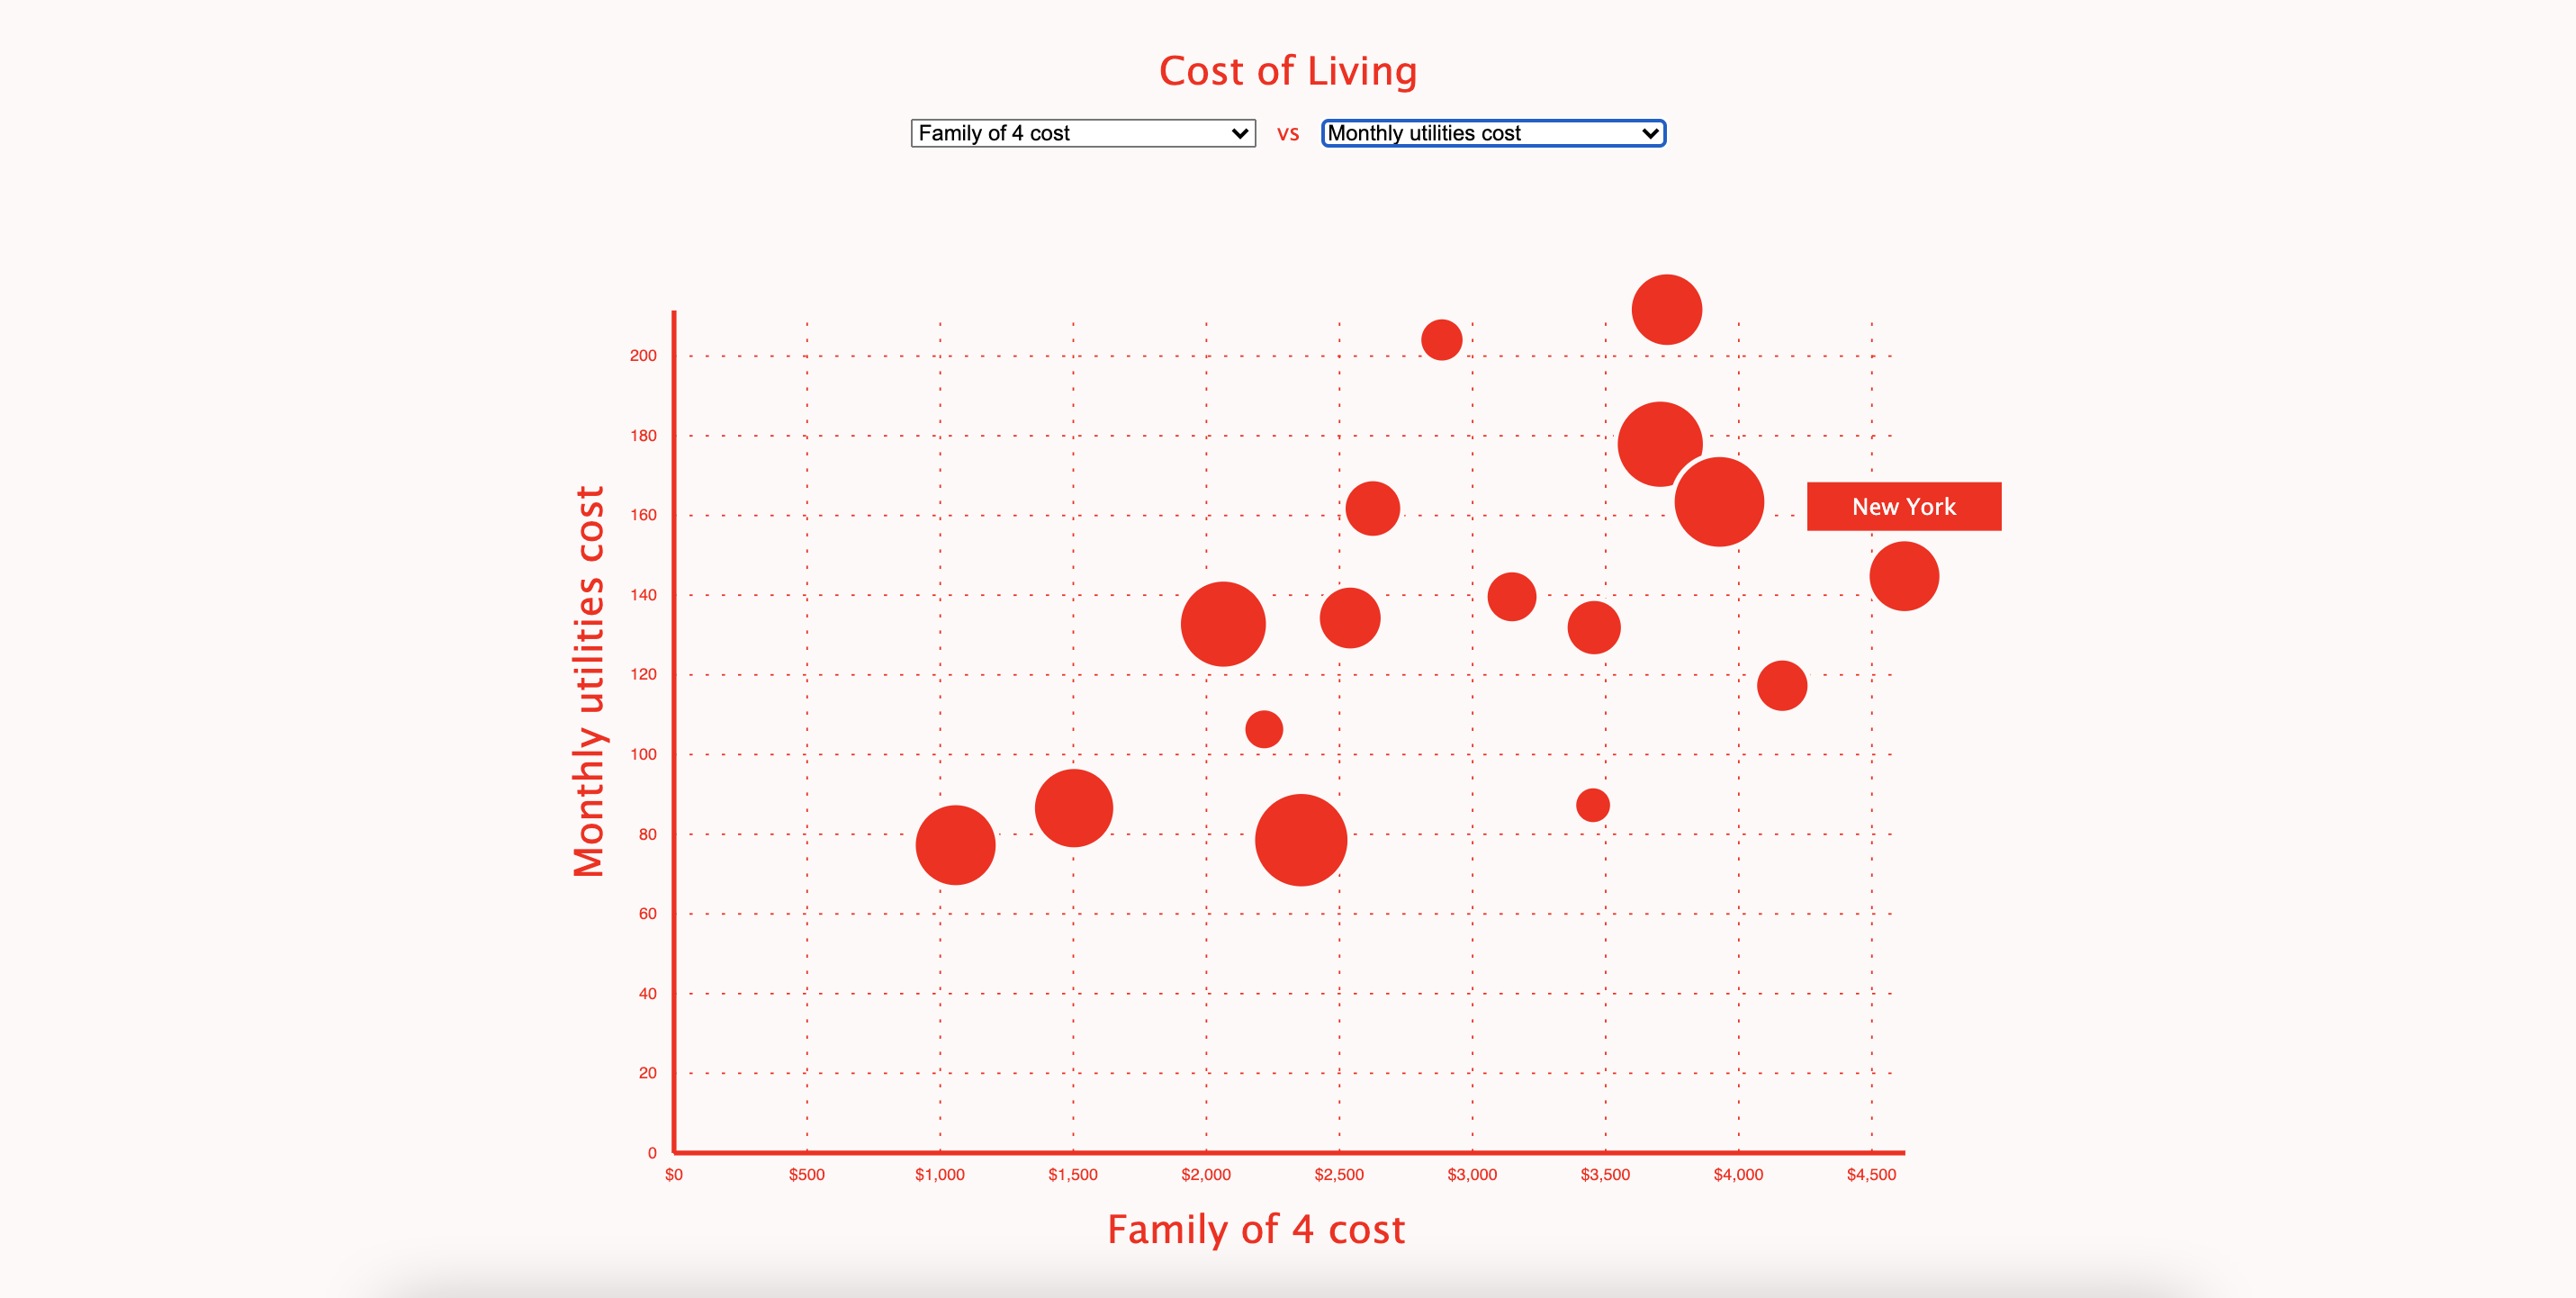
A scatterplot comparing the cost of living (transportation, housing, utilities) in cities across the world.

A list of movies, and their ratings from IMDB and metascore displayed as a vertical line graph down the page. Compare differences in ratings from critics and movie fans.

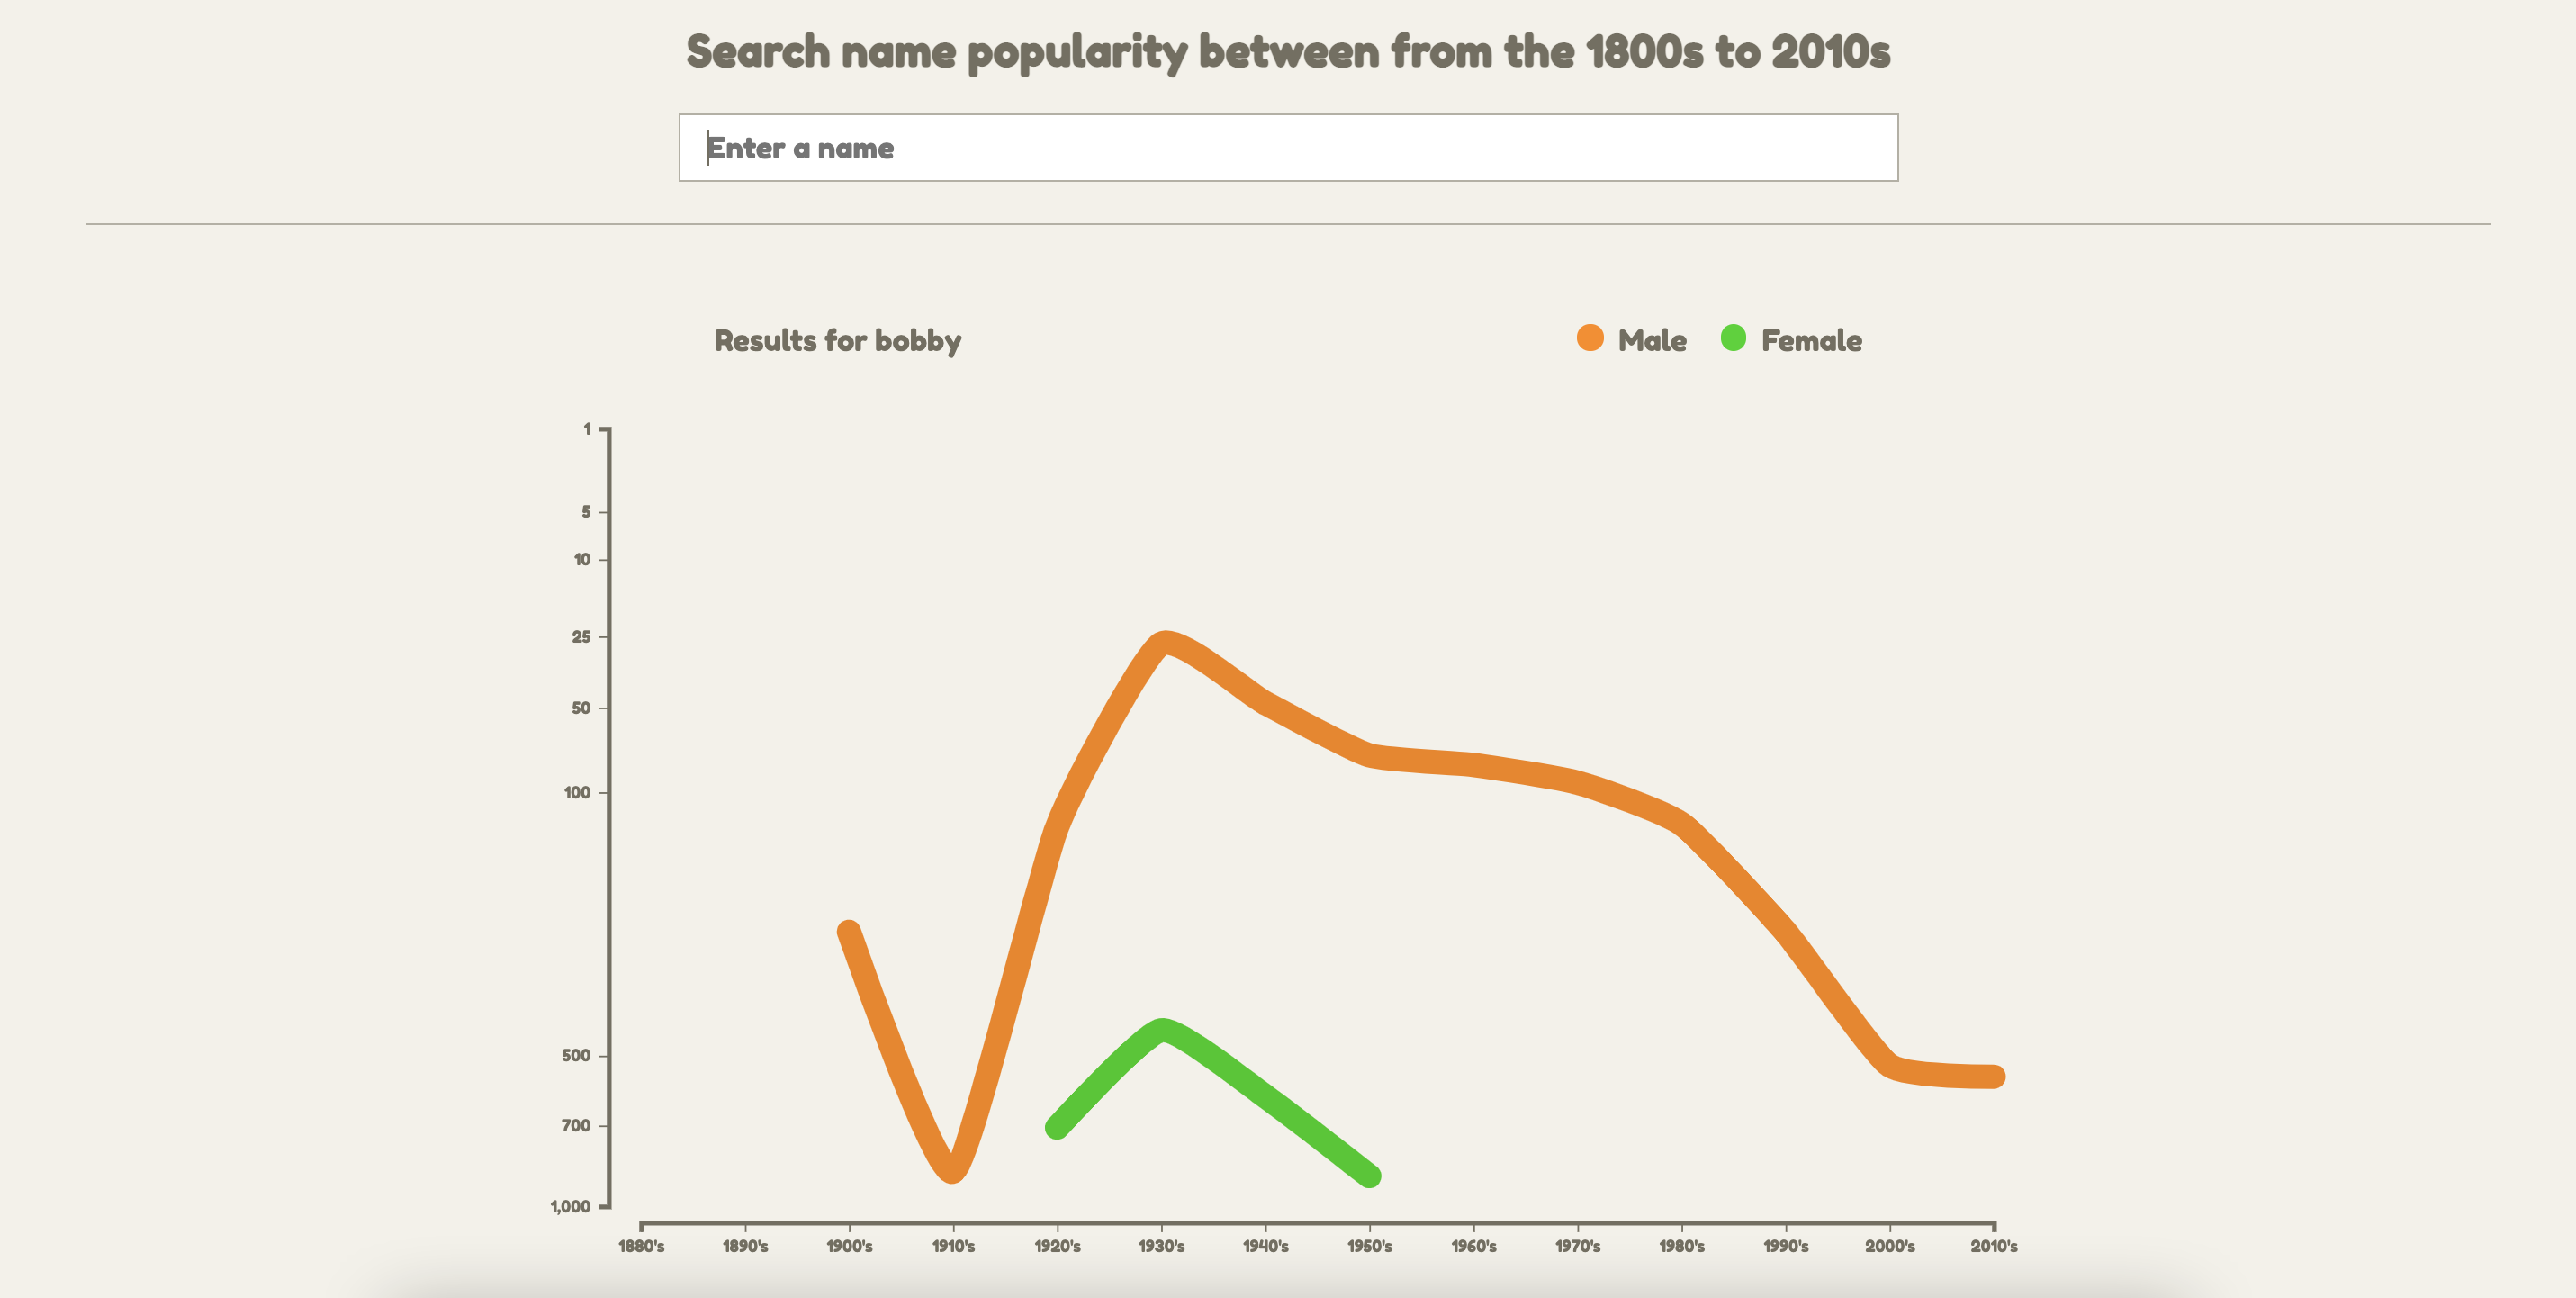
Search through a database of names, and view popularity rankings over time as a broken line.
- D3.js
- Express.js
Developed using Node 14 and packages managed with npm
- Fork and clone this repository.
- Install dependencies with
npm install - Start the development server with
npm start
- cookie-parser
- debug
- ejs
- express
- http-errors
- morgan
- None