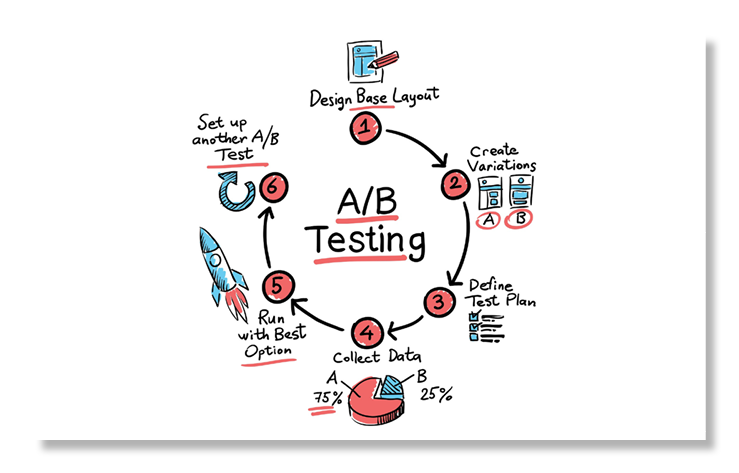
A/B testing is a statistical method used to compare two versions of a product or service, usually a website or mobile app, to determine which one performs better in terms of user behavior or conversion rates.
In A/B testing, the two versions being tested are randomly shown to separate groups of users, with one group seeing the original or control version and the other group seeing a modified or test version. Both versions are shown under the same conditions and for the same duration, and user behavior data such as click-through rates, conversion rates, or revenue generated are collected for each group.
The goal of A/B testing is to determine whether the changes made to the test version lead to a statistically significant difference in user behavior or performance compared to the control version. If the test version outperforms the control version, the changes are usually adopted, and if not, further iterations are made to improve the test version.
A/B testing is commonly used in digital marketing, e-commerce, and software development to optimize user experience, increase conversions, and drive revenue growth. It can be an effective tool for making data-driven decisions and improving the overall performance of a product or service.
Facebook recently introduced a new bidding type, 'average bidding', as an alternative to the existing bidding type called 'maximumbidding'.
One of our clients, bombabomba.com, decided to test this new feature and would like to run an A/B test to see if average bidding converts more than maximumbidding.
The A/B test has been going on for 1 month and bombabomba.com is now waiting for you to analyze the results of this A/B test. The ultimate success criterion for Bombabomba.com is Purchase. Therefore, the focus should be on the Purchase metric for statistical testing.
- CSV File Size : 26KB
- Total Variables : 4
- Total Row : 40
- Total Variables : 4
- Total Row : 40
In this data set, which includes the website information of a company, there is information such as the number of advertisements that users see and click, as well as earnings information from here. There are two separate data sets, the control and test groups. These datasets are in separate sheets of the ab_testing.xlsx excel. Maximum Bidding was applied to the control group and Average Bidding was applied to the test group.
| Variable | Description |
|---|---|
| Impression | Number of ad views |
| Click | Number of clicks on the displayed ad |
| Purchase | Number of products purchased after ads clicked |
| Earning | Earnings after purchased products |
- pandas, scipy.stats.
- shapiro, levene, ttest_ind
- Normality Assumption, Variance Homogeneity, p_value
- Please review the 'requirements.txt' file for required libraries.
