In this lab, you will build an end-to-end analytics solution using Azure Databricks, Unity Catalog, Lakeflow, Genie, AI/BI Dashboards, Power BI, and Databricks Apps.

Total time: 90 minutes
Difficulty: Beginner-friendly
Environment: All work is done in the browser inside this lab VM.
By the end of this lab, you will be able to:
- Build automated data pipelines using Lakeflow (Spark Declarative Pipelines) with built-in data quality checks and CDC
- Apply enterprise data governance with Unity Catalog (catalogs, schemas, and row-level security)
- Create semantic metric layers using Metric Views
- Build AI-powered dashboards with Databricks AI/BI and Genie
- Integrate Databricks with Power BI using DirectQuery
- Deploy and explore a full-stack app running on Databricks Apps
- Apply the medallion (Bronze/Silver/Gold) architecture for analytics data
===
The suggested timeline for this 90-minute lab is:
| Time | Activity |
|---|---|
| 00:00 - 00:05 | Introduction |
| 00:05 - 00:15 | Setup - Import repo, configure, deploy |
| 00:15 - 00:40 | Lab 01 - Lakeflow Data Transformation |
| 00:40 - 00:50 | Lab 02 - Unity Catalog Governance |
| 00:50 - 01:00 | Lab 03 - AI/BI Dashboards & Genie |
| 01:00 - 01:10 | Lab 04 - Publish to Power BI |
| 01:10 - 01:20 | Lab 05 - Databricks App Deployment & Exploration |
| 01:20 - 01:30 | Wrap-Up & Next Steps |
| Technology | Purpose |
|---|---|
| Azure Databricks | Unified analytics and AI platform |
| Unity Catalog | Governance, security, and lineage |
| Lakeflow Spark Declarative Pipelines | Declarative ETL/data pipelines |
| Databricks SQL | SQL analytics and warehousing |
| Metric Views | Centralized semantic metric layer |
| Databricks AI/BI Dashboards | Native BI dashboards |
| Genie | Natural language query experience |
| Databricks Apps | Full-stack application hosting |
| Microsoft Power BI | External BI visuals and reporting |
===
To begin, log into the virtual machine using the following credentials: [email protected](Win11-Pro-Base).Password+++
No local installation is required. All tools run in the browser.
The lab environment provides:
- Access to an Azure Databricks workspace
- Lakeflow Pipelines Editor enabled
- New pipeline monitoring enabled
- Web Terminal enabled
Note
If any of the above are not available, contact your proctor or instructor before continuing.
This lab uses a public GitHub repository that contains all notebooks, configuration, and app code.
Copy this URL when prompted in the steps:
You will import this repo into your Databricks workspace in the next section.
===
Follow these steps carefully before starting the lab modules.
- Open Microsoft Edge browser inside the lab VM
- In the browser address bar, right-click and paste: +++https://portal.azure.com+++ then press Enter
Warning
Do NOT click the URL directly from these instructions. Clicking will open a browser outside the lab VM. Instead, right-click the URL above to copy it, then paste it into the browser address bar inside the lab VM.
- Sign in with the username and TAP in the Resources tab
- On the Home page, under Resources click on View all resources
- Click the Azure Databricks Workspace resource (adb-lab531-*)
- Click Launch Workspace to launch the Azure Databricks Workspace
-
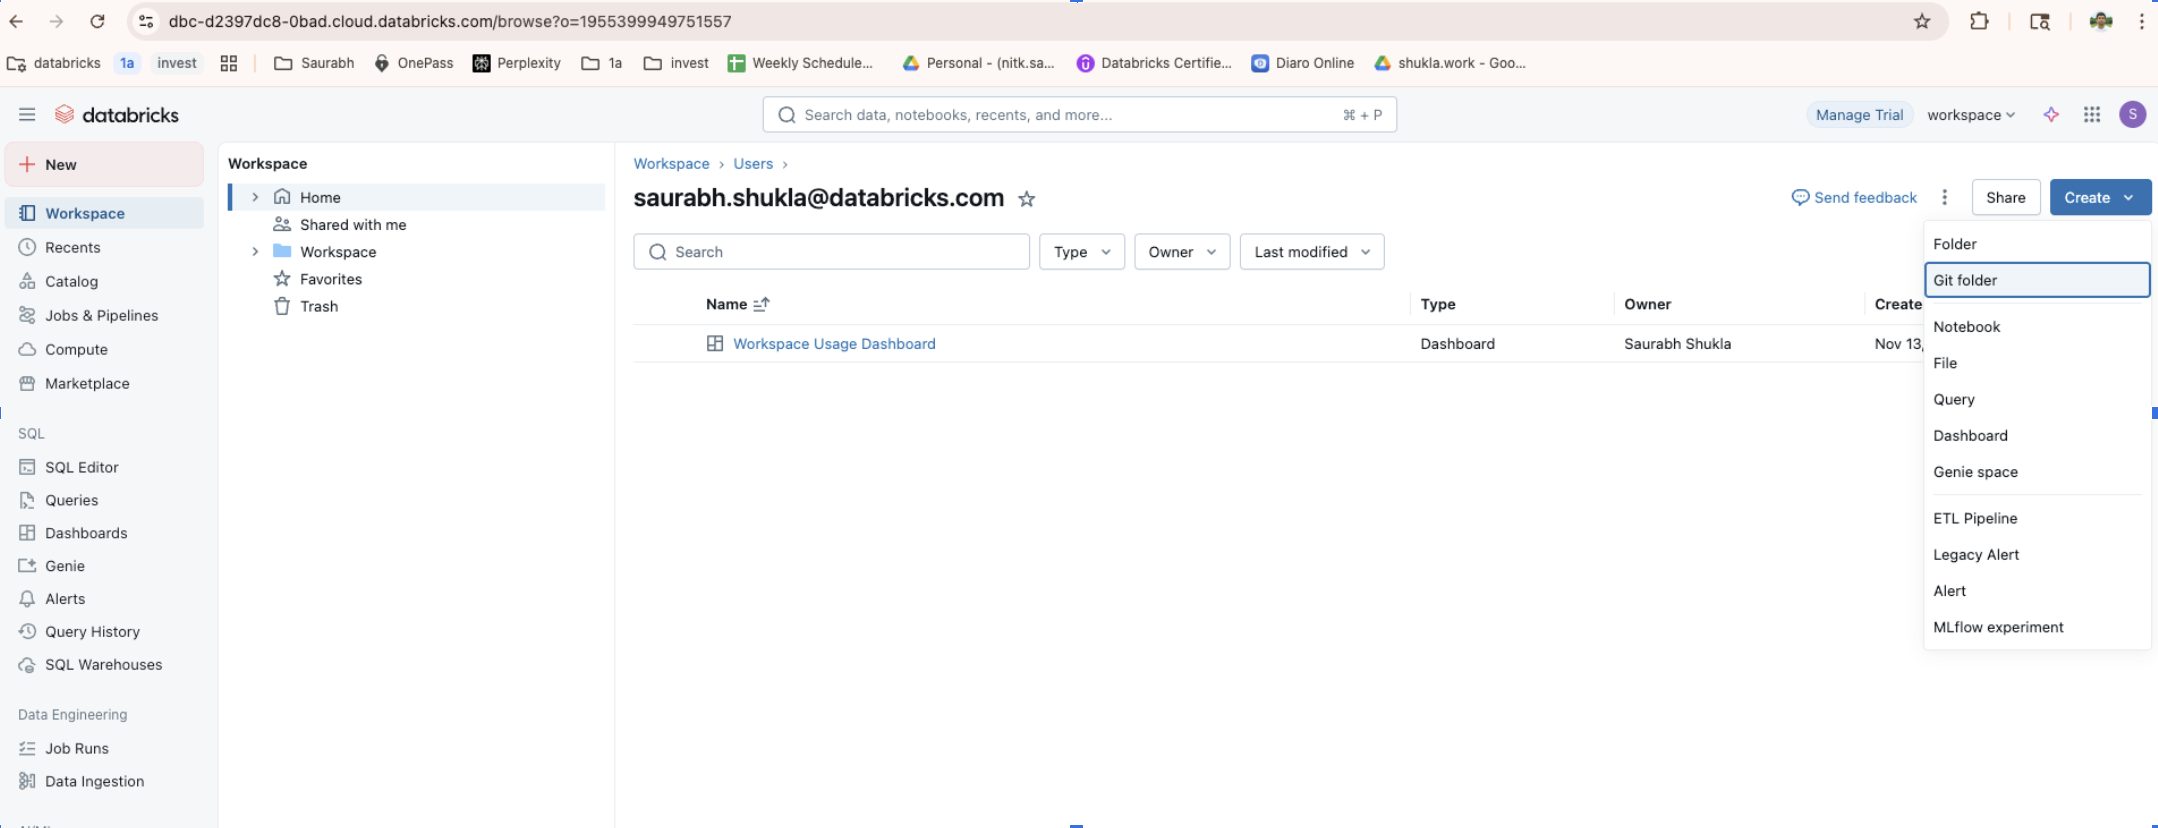
In the Databricks workspace, in the left sidebar select Workspace.
-
At the top, select Create.
-
Select Git folder.
-
In the Git Repository URL field, right-click and paste the following URL (right-click to copy first):
-
Select Create Git folder.
-
Wait for the folder to appear under your user or workspace tree.
You will now create your personal catalog, schema, and supporting resources.
-
In the imported repo, navigate to:
lab/00-setup/01_create_user_resources
-
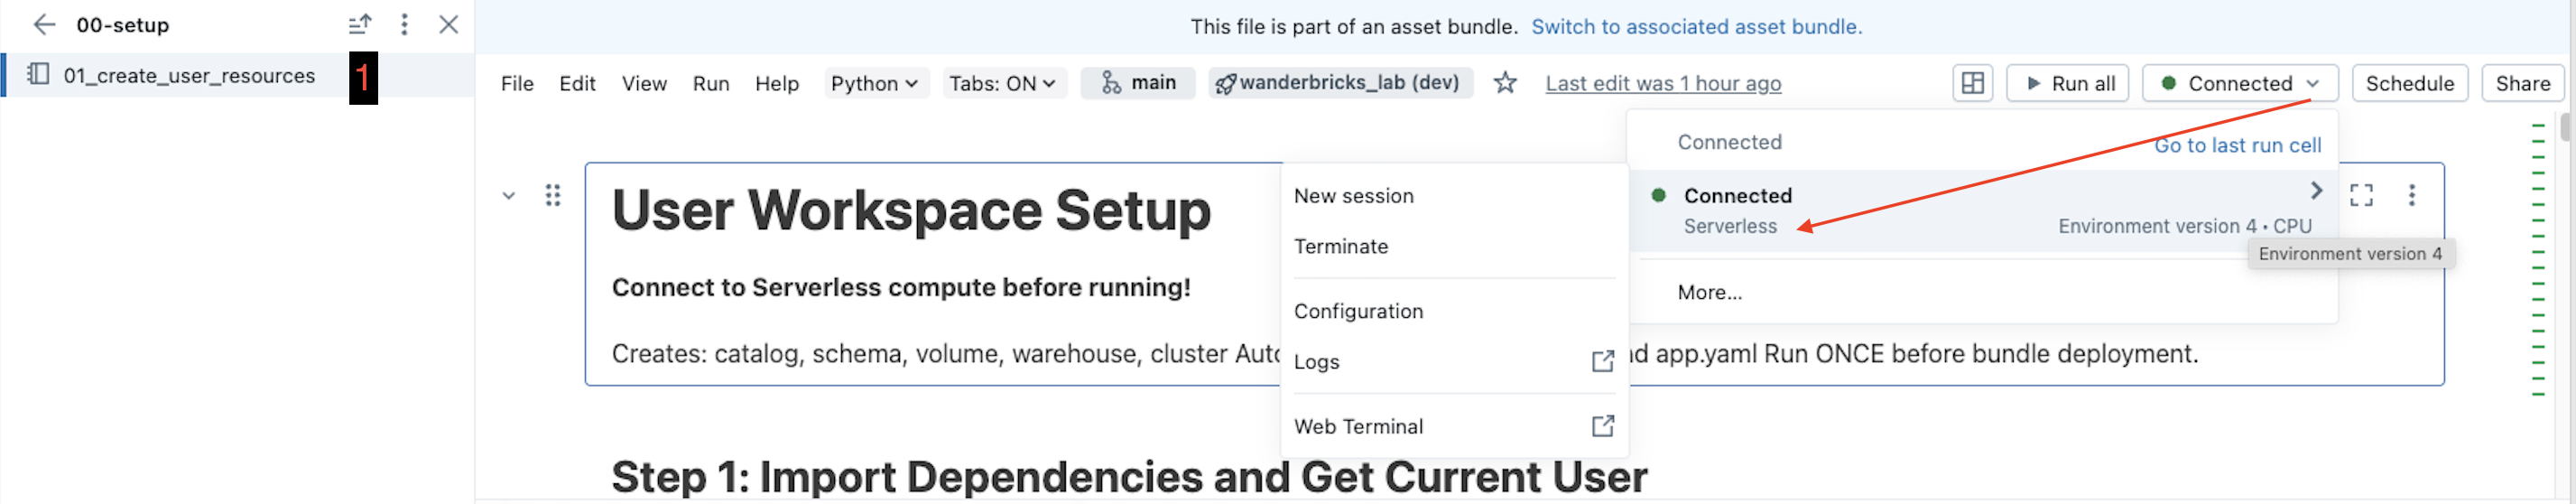
Open the 01_create_user_resources notebook.
-
In the top-right, set the compute to Serverless.
-
Select Run all on the notebook toolbar.
-
Wait for the notebook to complete before continuing.
This notebook creates:
- Catalog: ignite_2025
- Schema: ignite_2025.<your_username>
- Volume: ignite_2025.<your_username>.file_data
- SQL warehouse: Serverless Starter Warehouse (if not already present)
- Deployment notebook: lab/00-setup/02_deploy_lab.ipynb customized for your repo path
[!Knowledge]
If any cell fails, review the error message in the notebook, fix the reported issue, and re-run that cell or re-run all cells.
===
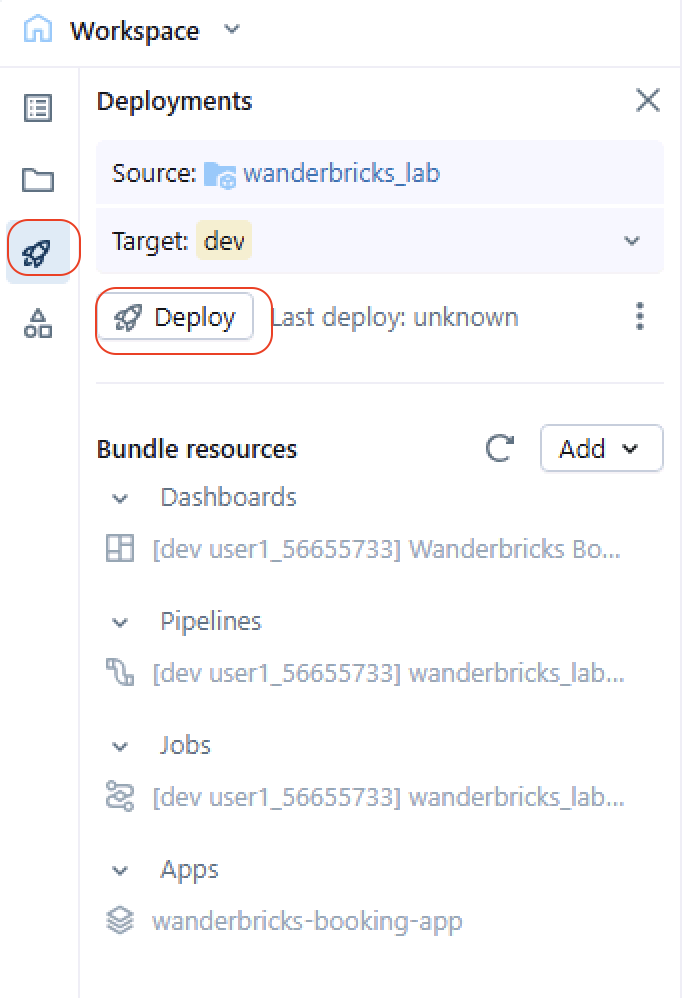
You now deploy the pipelines, job, dashboards, metric view, and app used in the labs.
The recommended approach is to deploy using the Databricks UI.
- In the left sidebar, select Deployments.
- Select the Deploy button.
- When prompted for a target environment, select dev.
- Confirm the deployment and wait 1-2 minutes for provisioning to complete.
If you prefer to use the Web Terminal:
-
Navigate to the folder icon
-
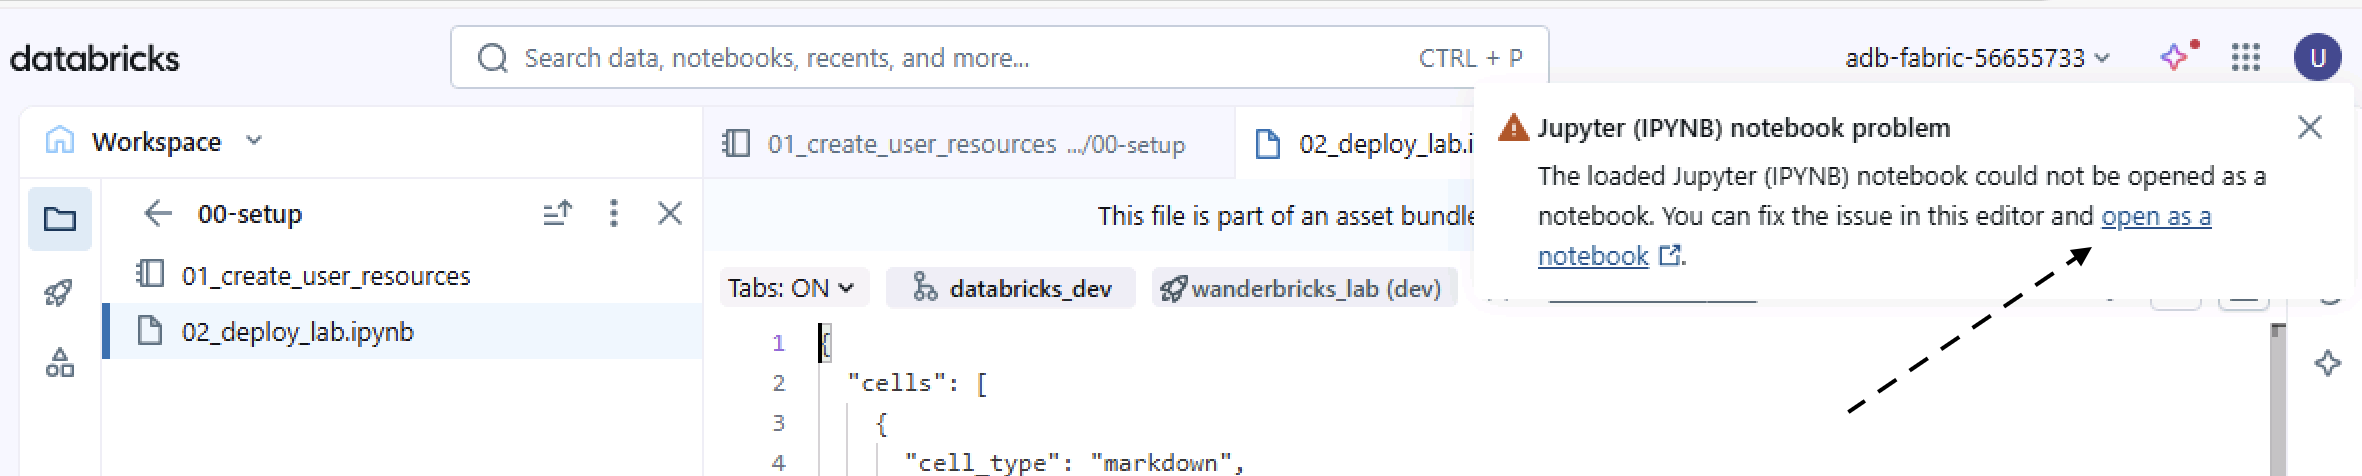
Open lab/00-setup/02_deploy_lab.ipynb
-
If a dialog appears about opening the IPYNB, select Open as notebook.
-
Connect the notebook to Serverless compute.

-
Click on the Environment icon on the right side bar (slider icon, second from the bottom).
-
Update the environment to at least Environment V2 (recommended: V4):
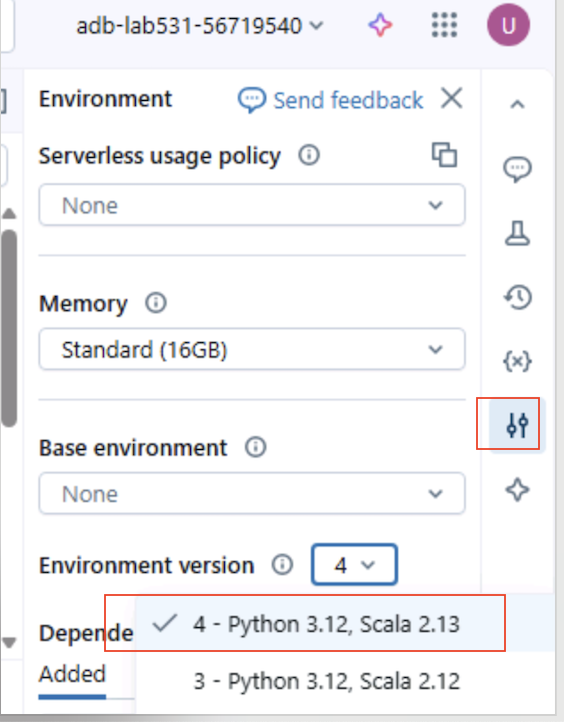
-
Then click Apply.
-
Click on the Terminal Icon in the bottom right of the right side panel
-
In the Web Terminal, copy and run the deployment commands shown in the notebook. Use right click > copy, right click > paste.
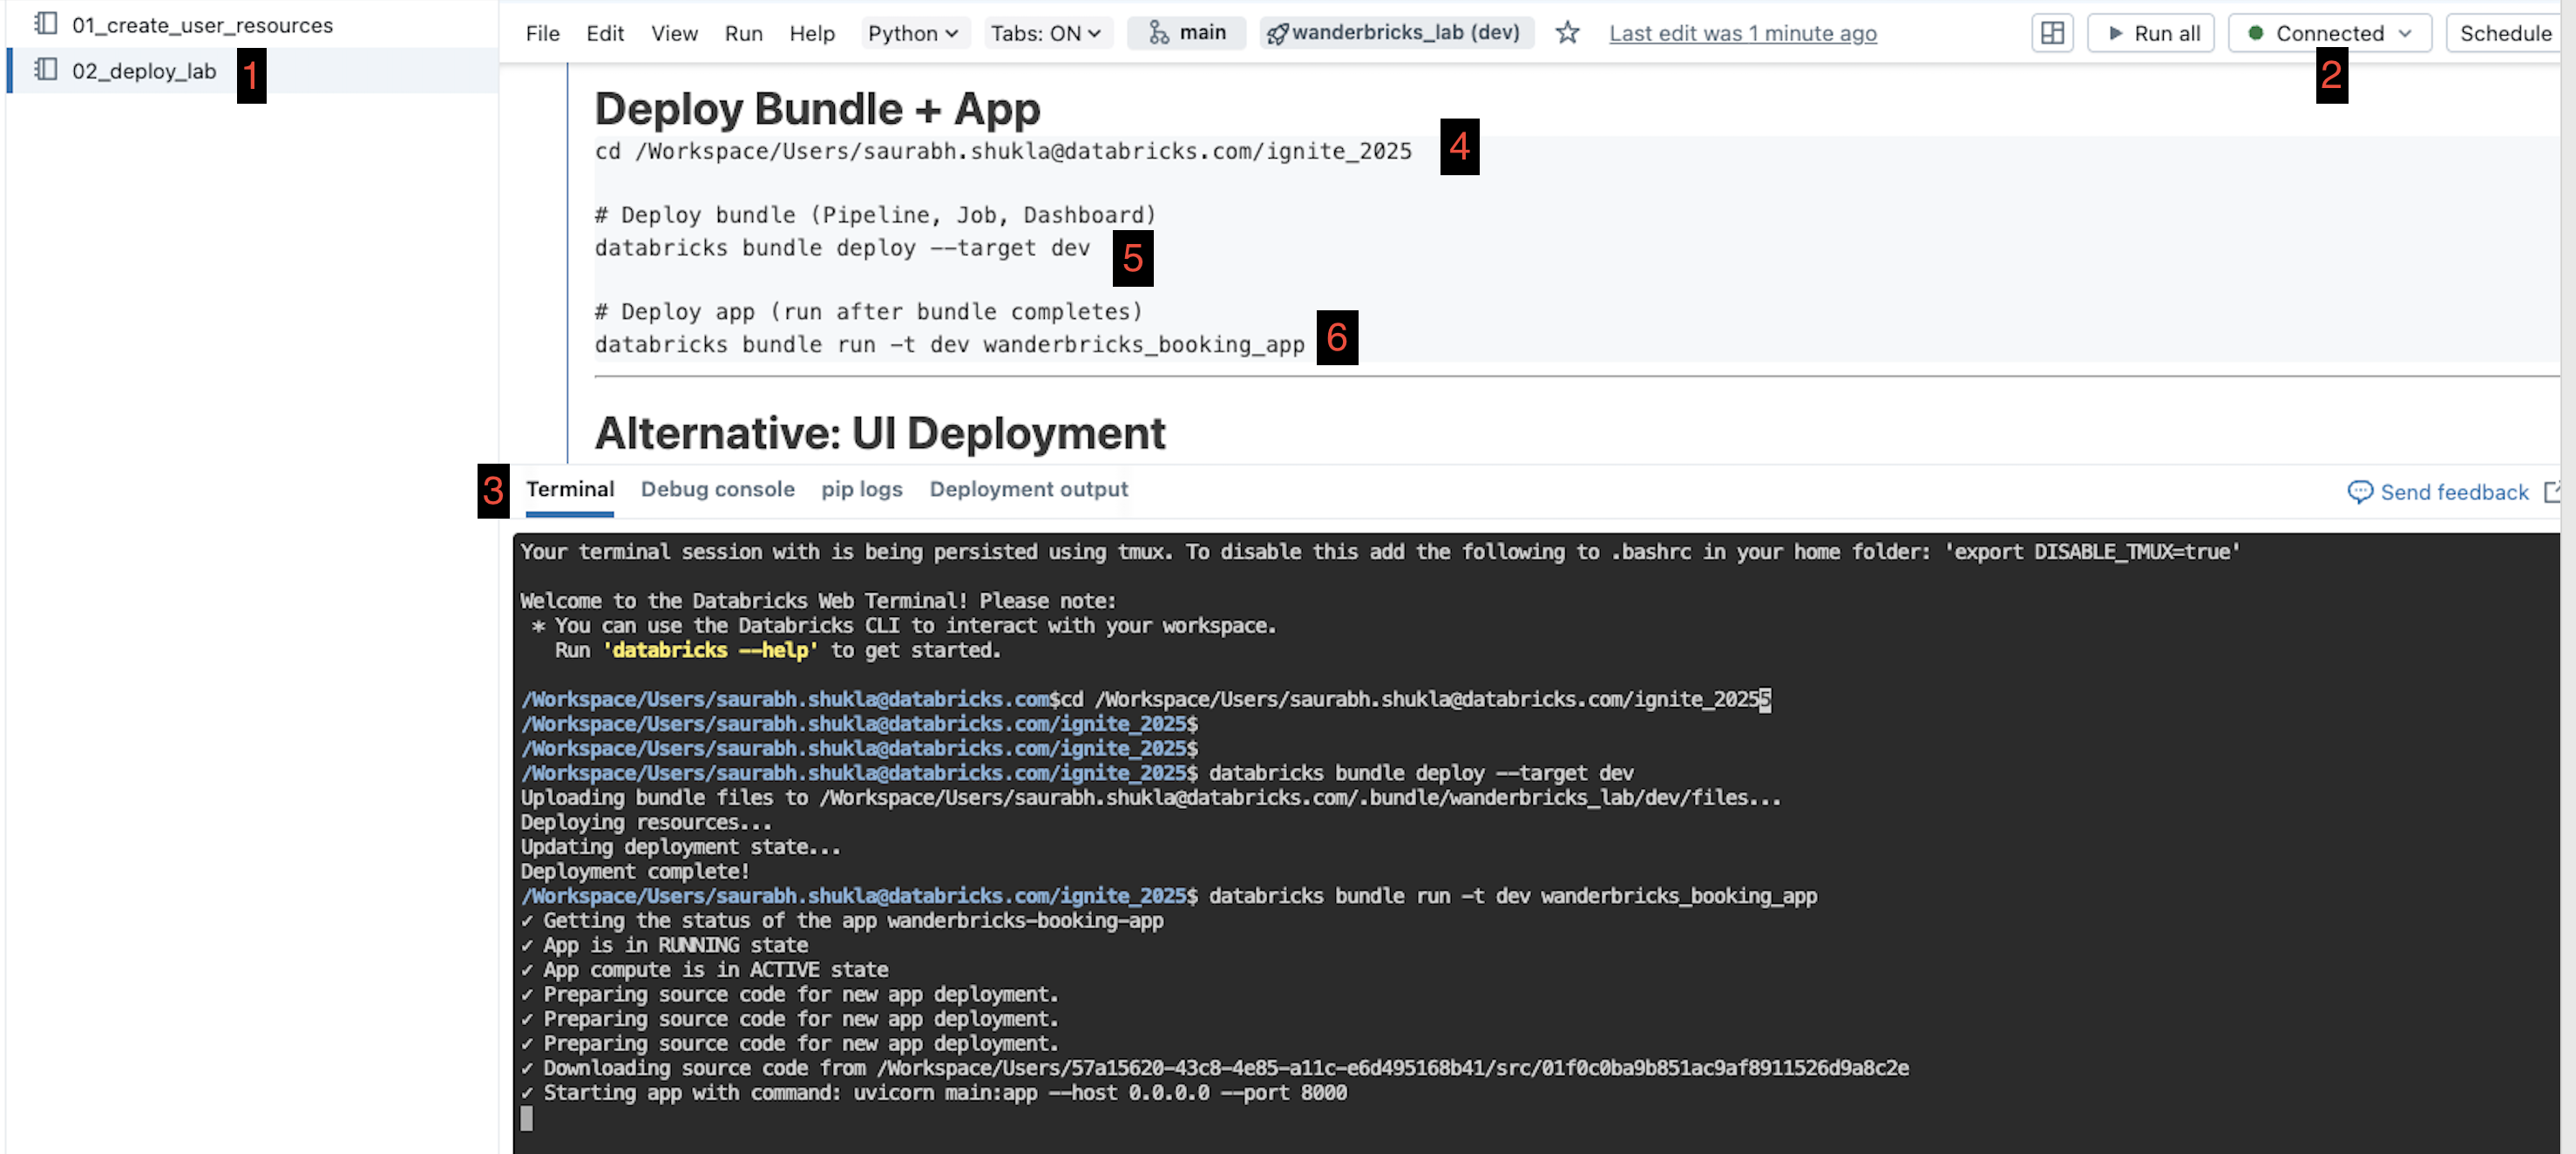
It will take 2-5 minutes for the deployment to complete.
Note
The notebook displays the exact commands you should run, including any environment-specific parameters.
The deployment (CLI or UI) creates:
- Lakeflow Pipeline: [dev your_name] wanderbricks_lab_etl
- Orchestration Job: [dev your_name] wanderbricks_lab_job
- AI/BI Dashboard: [dev your_name] Wanderbricks Bookings Dashboard
- Metric View: wanderbricks_bookings_metrics
- Databricks App: wanderbricks-booking-app
===
You will now run the orchestrated job that builds all tables and metric views.
-
In the left sidebar, select Jobs & Pipelines.
-
Locate the job with a name similar to:
[dev your_name] wanderbricks_lab_job
-
Select the job name to open it.
-
In the top-right corner, select Run now.
The job contains two main tasks:
-
Pipeline full refresh (3-4 minutes)
- Triggers the Lakeflow pipeline for a full refresh
- Builds dimension tables and fact table from scratch
- Ensures a clean, consistent state
-
Metric view creation (about 1 minute)
- Creates wanderbricks_bookings_metrics for BI and Genie
[!Hint]
While the job runs, you can select individual tasks to open their run details and review progress or logs.
===
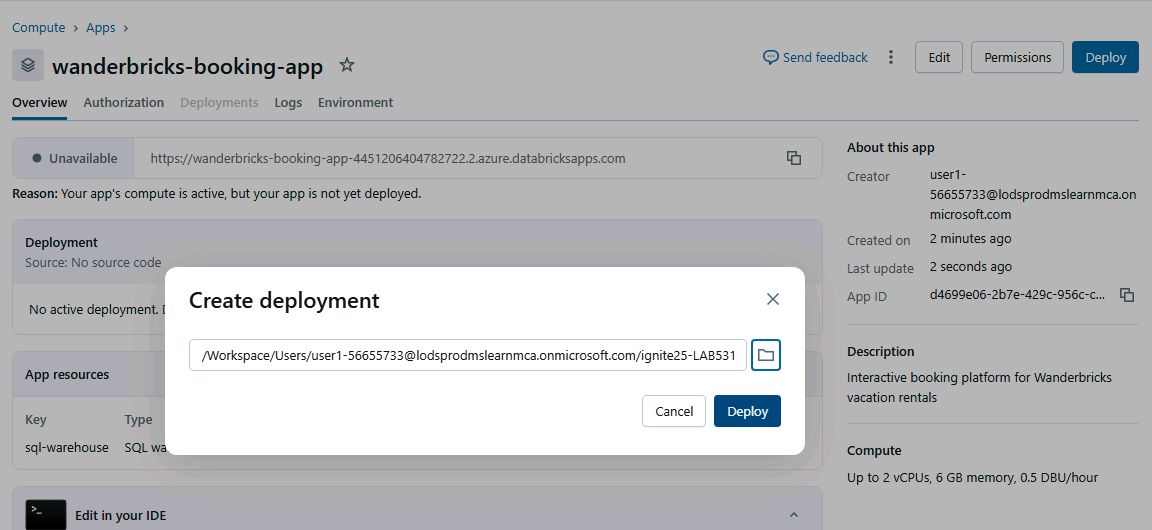
You will now make sure the Wanderbricks app is running and deployed.
If you used the CLI deployment, the app may already be running. Use these steps to confirm and deploy if needed.
-
In the left sidebar, select Compute.
-
Select the Apps tab.
-
Locate the app named:
wanderbricks-booking-app
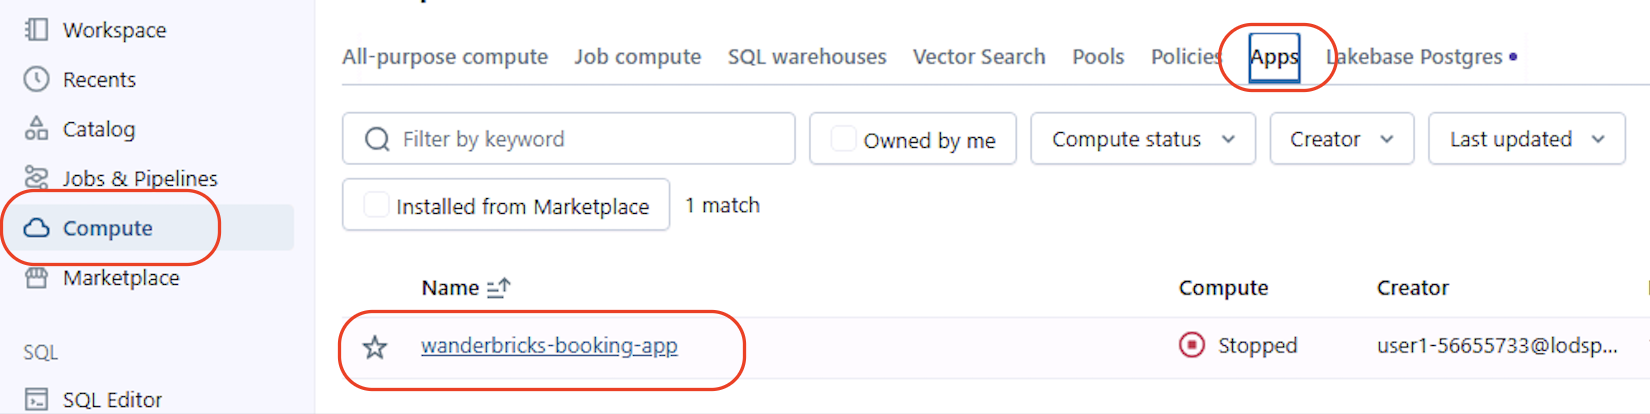
- If the app status is Stopped, select Start and wait until the app shows as Running.
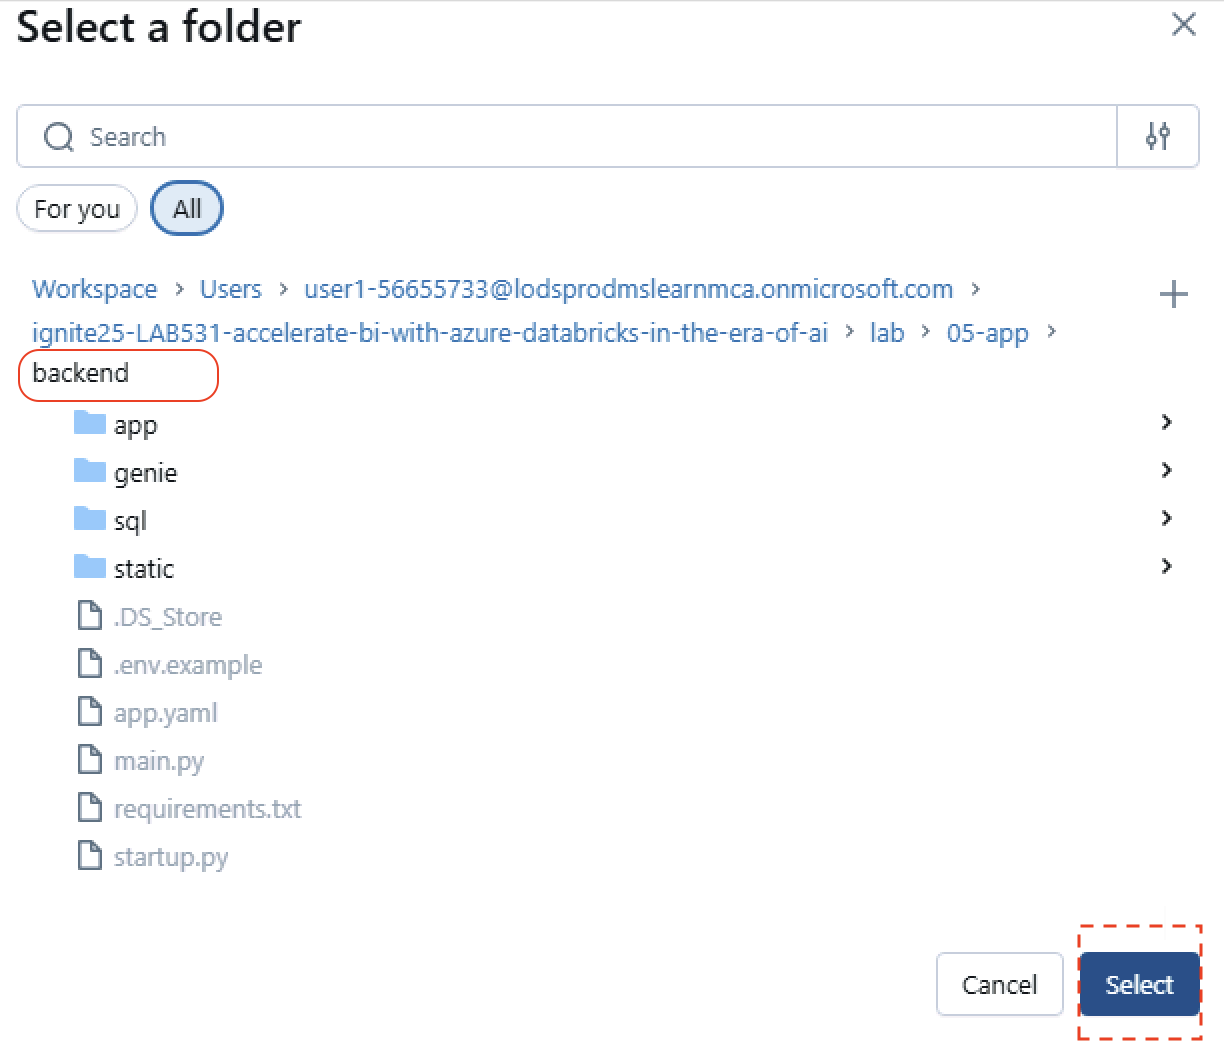
- If you are prompted to deploy, select Deploy, then choose the backend folder when asked for the app source.
Once deployed:
- On the Apps tab, select wanderbricks-booking-app.
- Select Open to launch the app UI.
You should see:
- Property search experience
- Manager dashboards and KPIs
===
In this lab, you will explore the Lakeflow SDP pipeline and how it implements a medallion architecture.
The Lakeflow pipeline builds:
- Bronze, Silver, and Gold tables for booking data
- Five dimension tables
- One fact table with change data capture (CDC)
-
In the workspace, navigate to:
Users/[your_name]/ignite25-LAB531-accelerate-bi-with-azure-databricks-in-the-era-of-ai
-
Click on Open in editor
-
Then navigate to
lab/01-Data-Transformation/transformations/
-
Review the following files:
- dim_customer.py
- dim_date.py
- dim_employee.py
- dim_host.py
- dim_property.py
-
In each file, look for:
- @dp.materialized_view() decorators
- @dp.expect() data quality expectations
- generate_sk() for surrogate keys
[!Knowledge]
Lakeflow Spark Declarative Pipelines allow you to define what the data objects should look like, and the engine decides how to build and maintain them.
-
In the same folder, open:
fact_bookings.py
-
Locate:
- dp.create_streaming_table(...) for real-time ingestion
- dp.create_auto_cdc_flow(...) for change data capture
- Joins from the CDC stream into dimension tables to build the enriched fact table
In the same folder structure, open:
lab/01-Data-Transformation/utilities/common_functions.py
Review helper functions such as:
- generate_sk()
- get_region_udf()
- get_season()
-
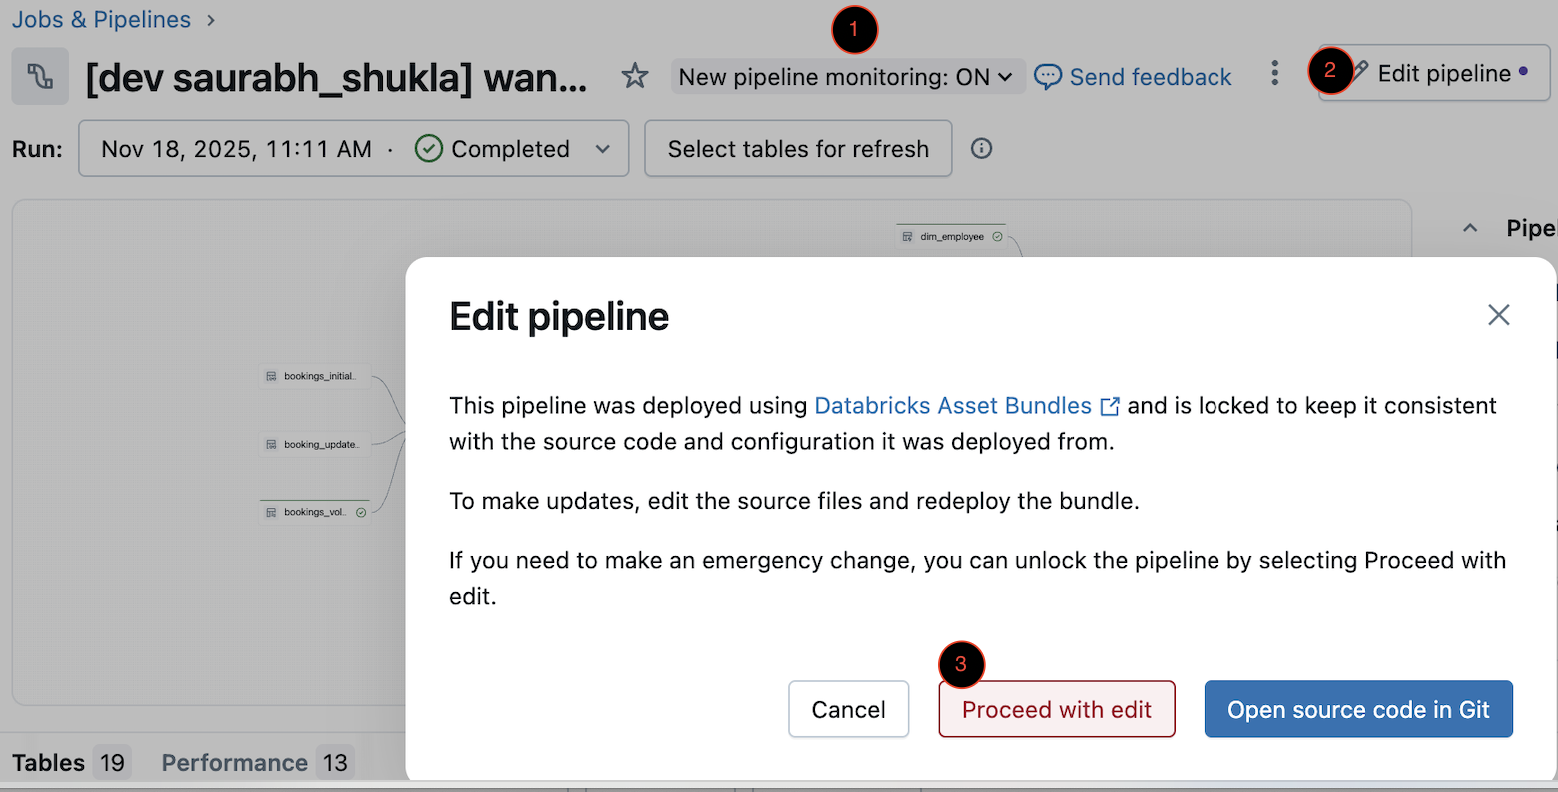
In the left sidebar, select Jobs & Pipelines (or Pipelines, depending on your UI).
-
Open the pipeline named:
[dev your_name] wanderbricks_lab_etl
-
Verify the (1)New pipeline monitoring toggle shows
ON. select (2) Edit pipeline and choose (3) Proceed with edit.
- Review the following tabs:
- Flow / Graph - DAG of pipeline steps
- Lineage - Upstream and downstream data dependencies
- Data quality - Data validation and expectations
- Event log - Detailed run history
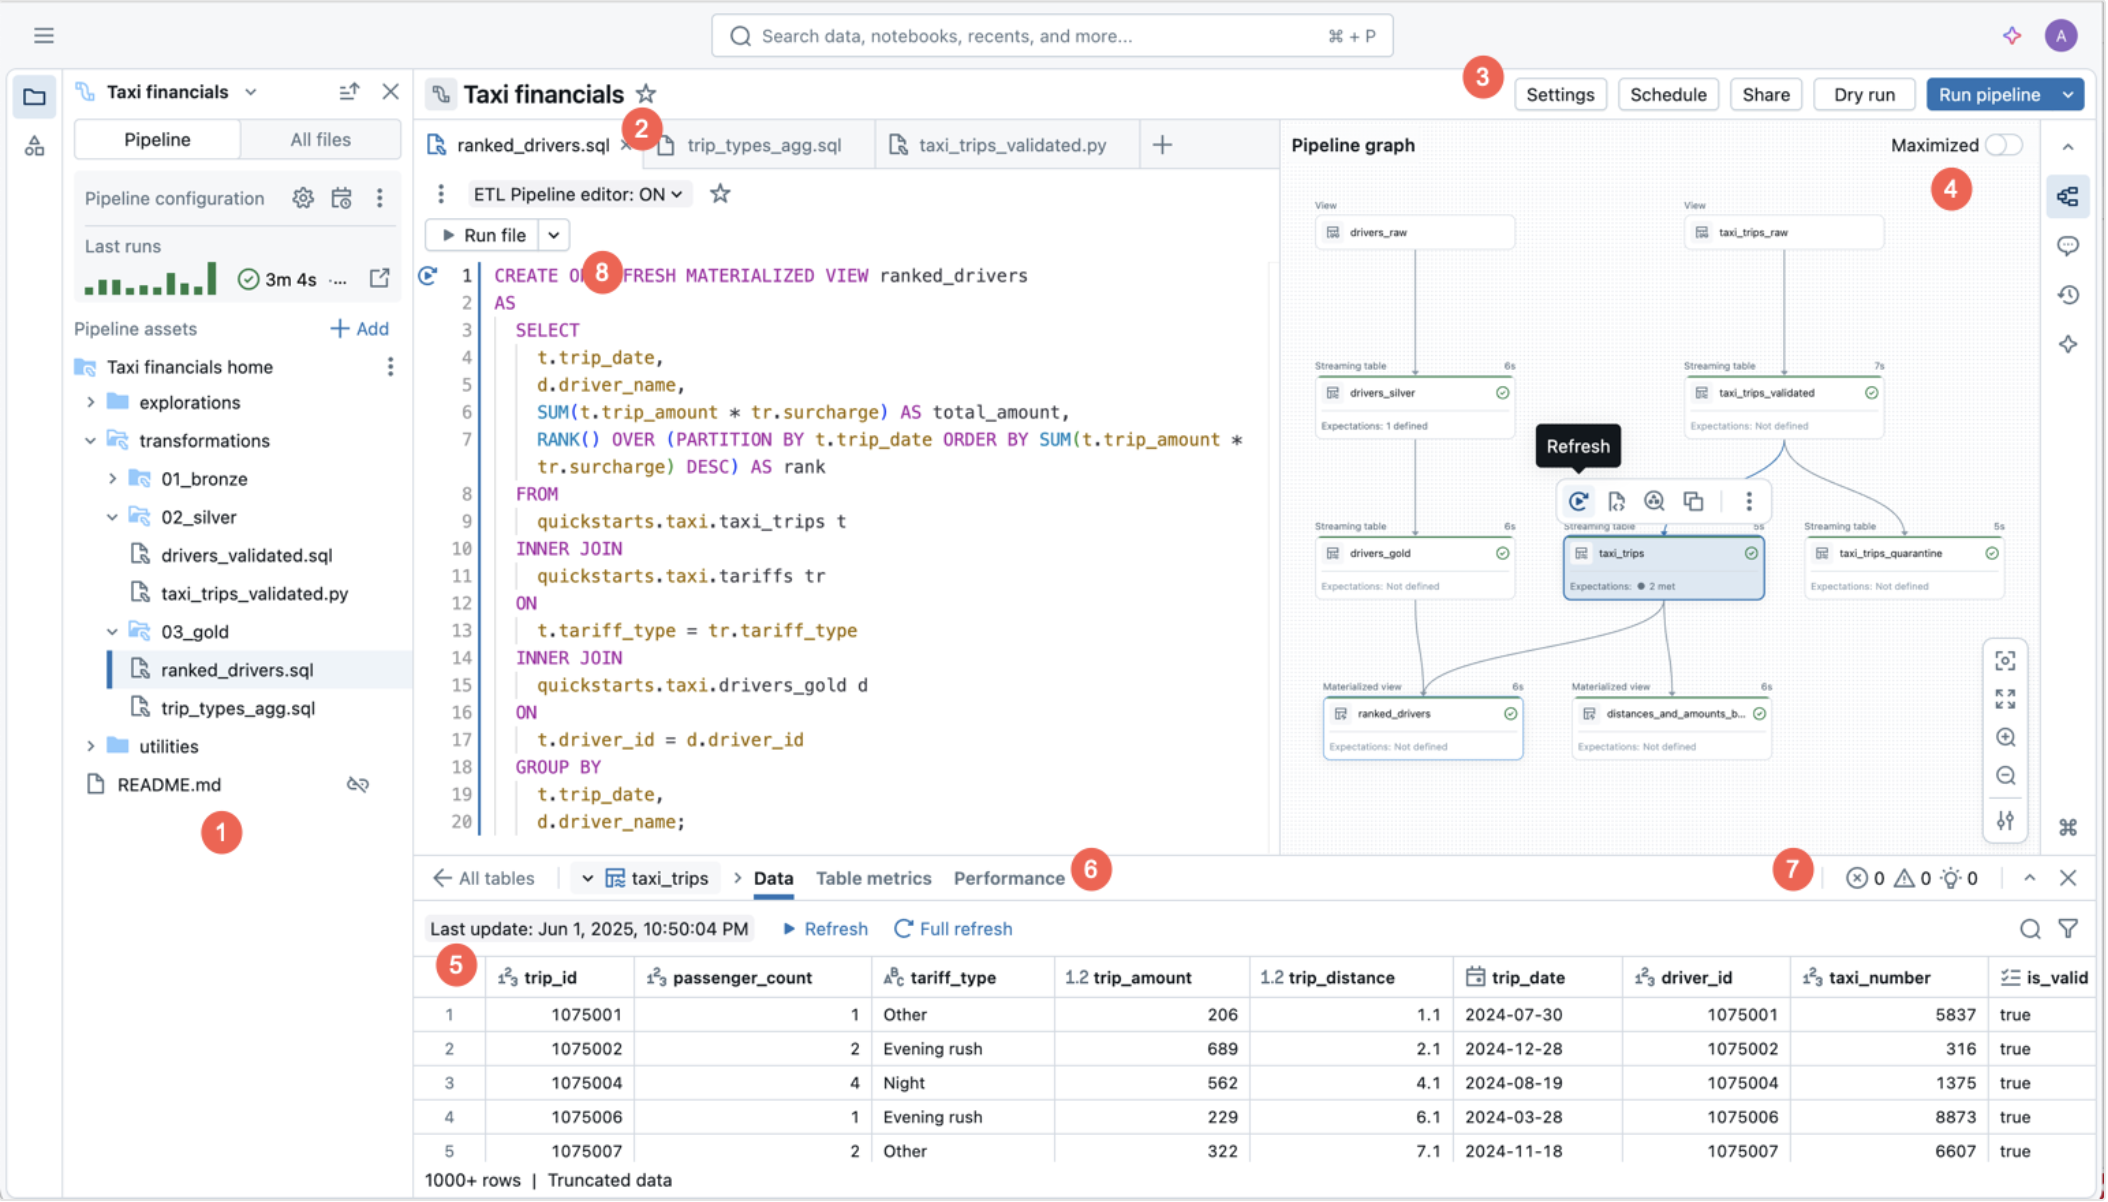
[!Hint]
Select individual nodes in the pipeline graph to see input tables, output tables, and data quality status.
===
In this lab, you will explore Unity Catalog tables and metric views created by the pipeline and job.
-
In the left sidebar, select Catalog.
-
Navigate to the catalog and schema you created, for example:
ignite_2025 → [your_username] → Tables → dim_customer
-
Select dim_customer.
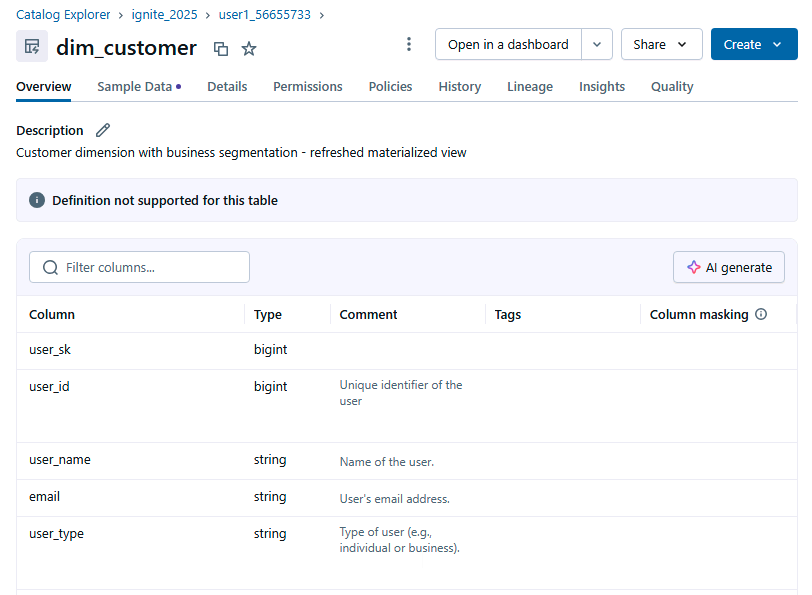
- Review the following tabs:
- Overview - Column list and basic info
- Sample data - Data preview
- Details - Table properties, storage location
- Permissions - Access control configuration
- Lineage - Data flow from source to downstream objects
- On the Overview tab for
dim_customer, locate the AI generate option for column descriptions. - Select AI generate.
- Review the generated descriptions and confirm that they match the meaning of each column.
Note
AI-generated descriptions can be a starting point. You can manually adjust descriptions for critical business fields.
-
In the Catalog, navigate to your metric view, for example:
ignite_2025 → [your_username] → Tables → wanderbricks_bookings_metrics
-
Select the metric view.
-
On the Overview tab, review:
- Measures (such as total revenue, total bookings, average nightly rate)
- Dimensions (such as country, property type, host, booking channel)
-
On the Details tab, review:
- YAML configuration
- Source table and joins to dimension tables
[!Knowledge]
Metric views provide a shared, governed semantic layer so that BI tools and Genie use consistent business logic.
===
This lab focuses on the Databricks AI/BI Dashboard and Genie for natural language analytics.
-
In the left sidebar, select Dashboards.
-
In the search box, search for:
[dev your_name] Wanderbricks Bookings Dashboard
-
Open the dashboard.
On the dashboard:
- Use filters to filter by date range, country, and property type.
- Inspect time series charts for revenue and bookings.
- Examine breakdowns by region, property type, and booking source.
- Try cross-filtering: click one visual and see other visuals filter.
[!Hint]
Hover over visual elements to see tooltips and exact metric values.
-
From the Databricks UI, open the Genie experience: Genie under SQL in the left nav bar.
-
Click New to create a new Genie space if one is not already configured.
-
Connect your data:
- Catalog: ignite_2025
- Schema: [your_username]
- Metric view: wanderbricks_bookings_metrics
-
Name the Genie space: Wanderbricks Booking Insights.
-
In Settings, add a description such as:
This Genie space provides analytics for the Wanderbricks booking platform using a metric view with predefined measures and dimensions.
-
Set the Default warehouse to your Serverless SQL warehouse.
-
In Instructions, add guidance like:
Use MEASURE() to reference metrics (Total Bookings, Total Revenue, Cancellation Rate). Focus on 2025 data by default.
Click New chat and try questions such as:
What is the total revenue for 2025?
Show monthly revenue by customer region for 2025
Which property types have the highest cancellation rates?
Which cities have the most bookings in 2025?
For each query, Genie shows:
- The generated SQL
- A results table
- A visualization
- Optional AI-generated insights
[!Knowledge]
Genie uses the governed metric definitions from the metric view so that business users do not need to know SQL or table structure.
===
In this lab, you will see how to publish Databricks data to Power BI using DirectQuery.
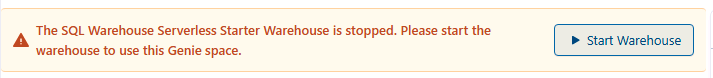
Note
Depending on your hosted environment, some Power BI steps may already be completed or simulated. Follow any additional instructions from your proctor if there are environment-specific differences.
-
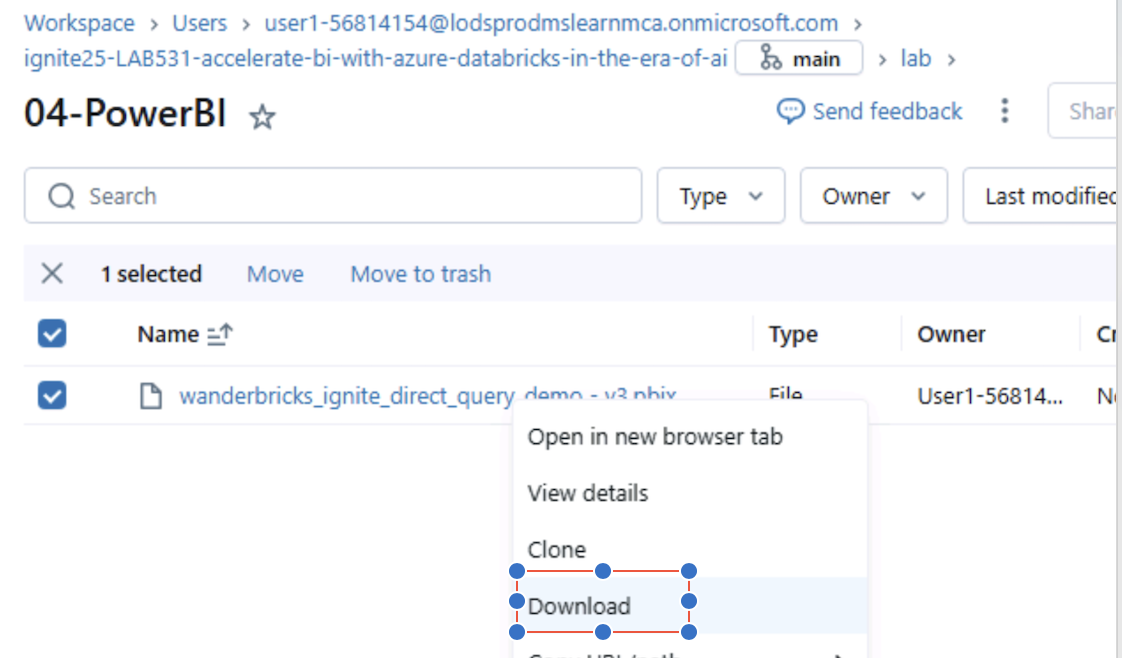
In the Databricks workspace, navigate to your Git repo folder.
-
Go to: lab/04-PowerBI/
-
Locate the file:
wanderbricks_ignite_direct_query_demo - v3.pbix
-
Right-click the file and select Download.
- Open a browser tab inside the lab VM and go to https://fabric.microsoft.com.
- Sign in with your Username on the resources tab if you are not already signed in.
- In Fabric, open My workspace.
- Select Import → Report, Paginated Report or Workbook.
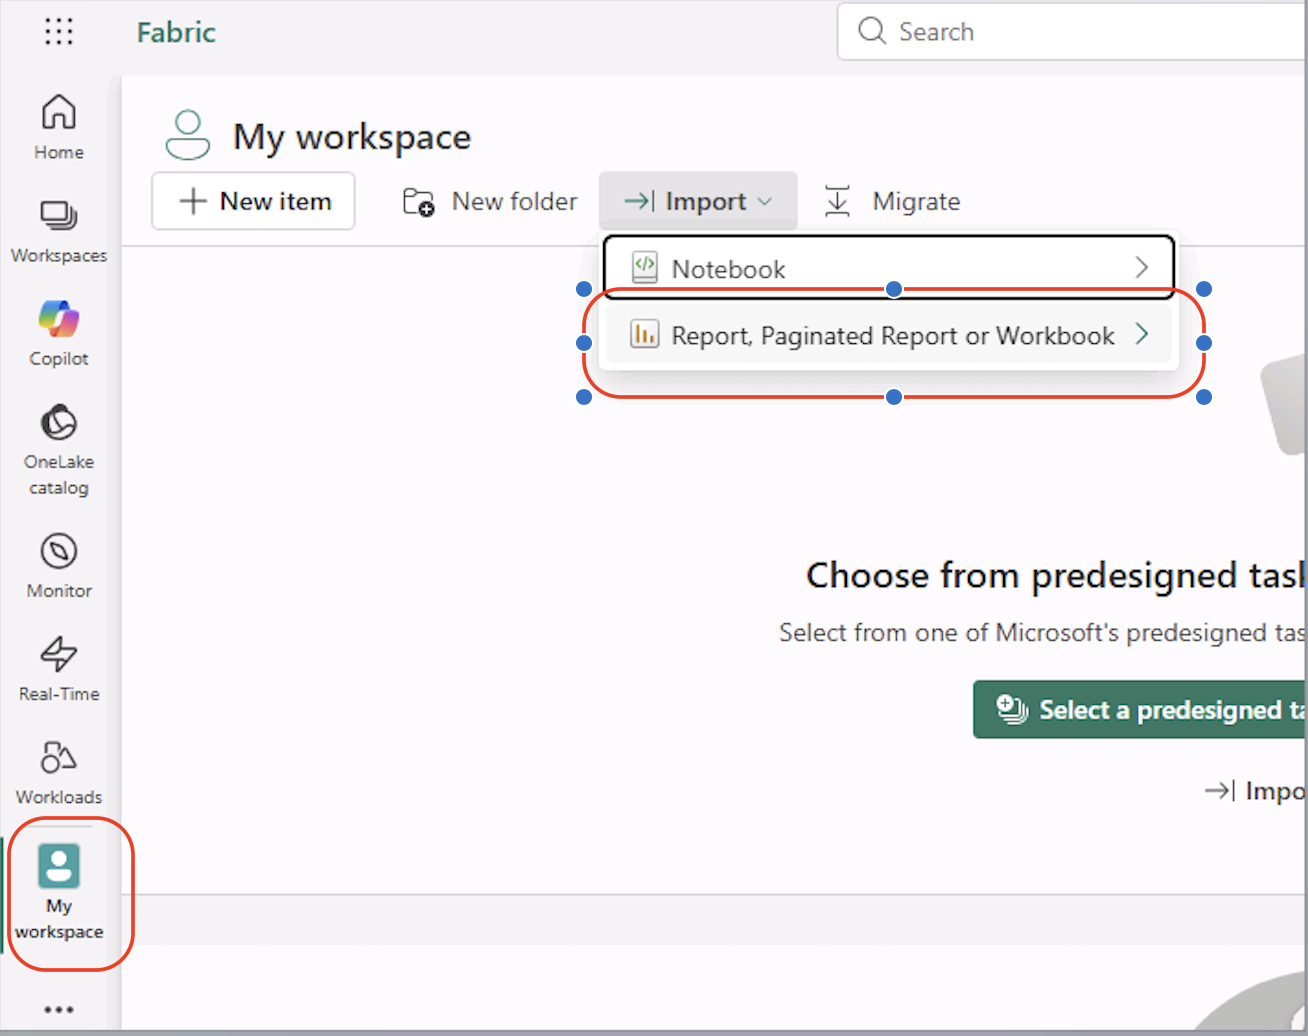
- Browse to the downloaded
.pbixfile and upload it.
- After import completes, click on the Power BI semantic model
- Navigate to the Settings for the dataset / report.
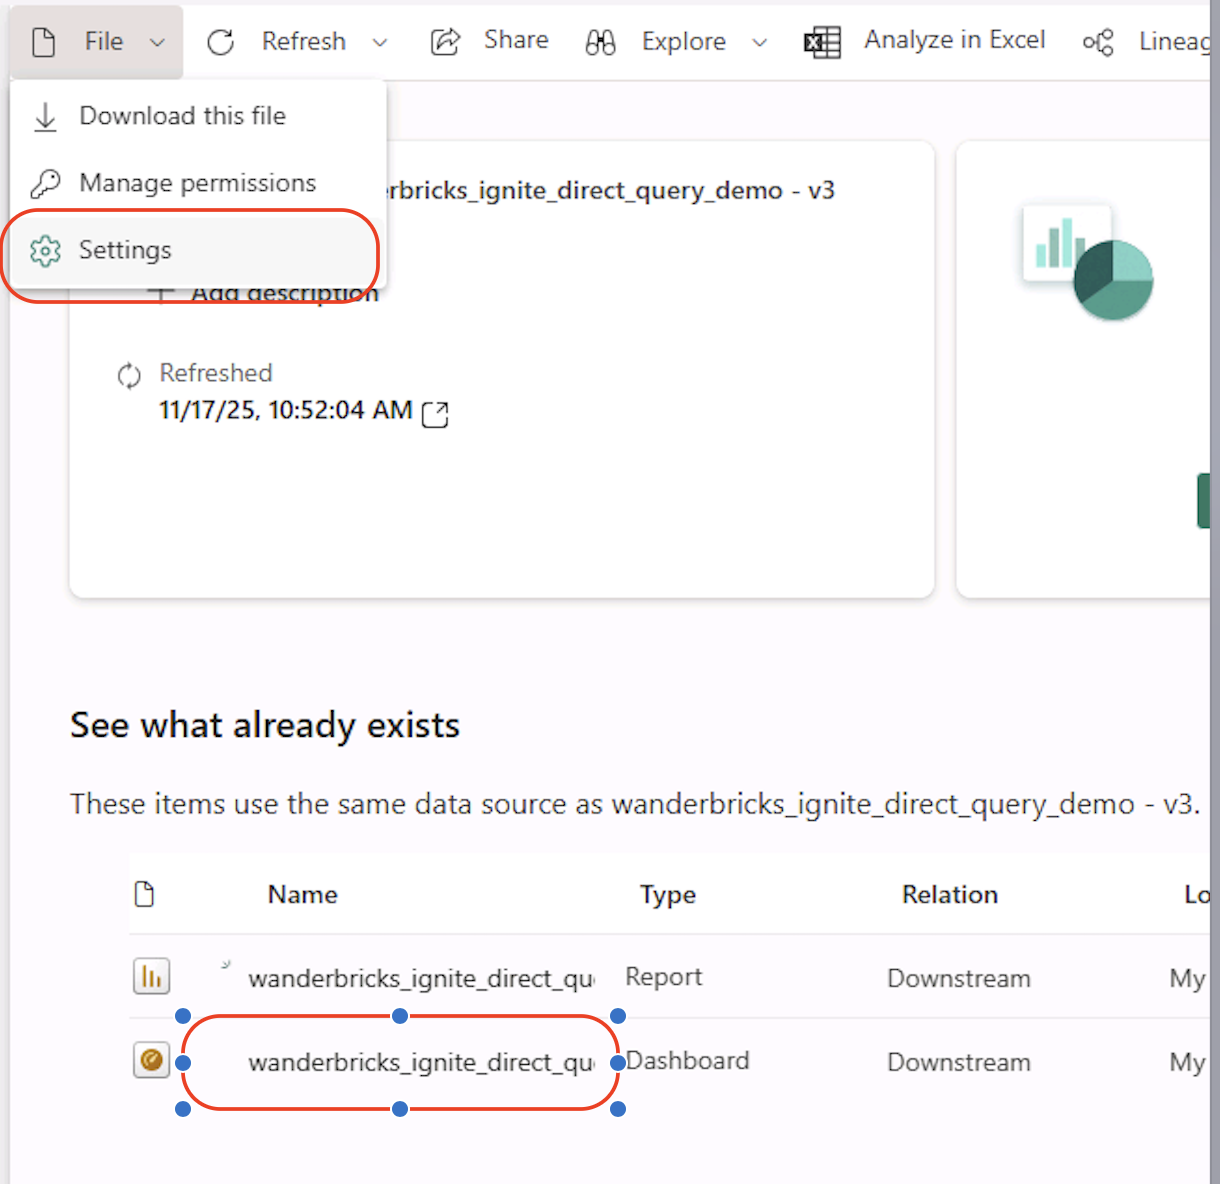
- Update the parameters using your Databricks SQL Warehouse connection details:
- ServerHostName
- HTTPPath
- UC_Catalog: ignite_2025
- UC_Schema: change this to your user schema
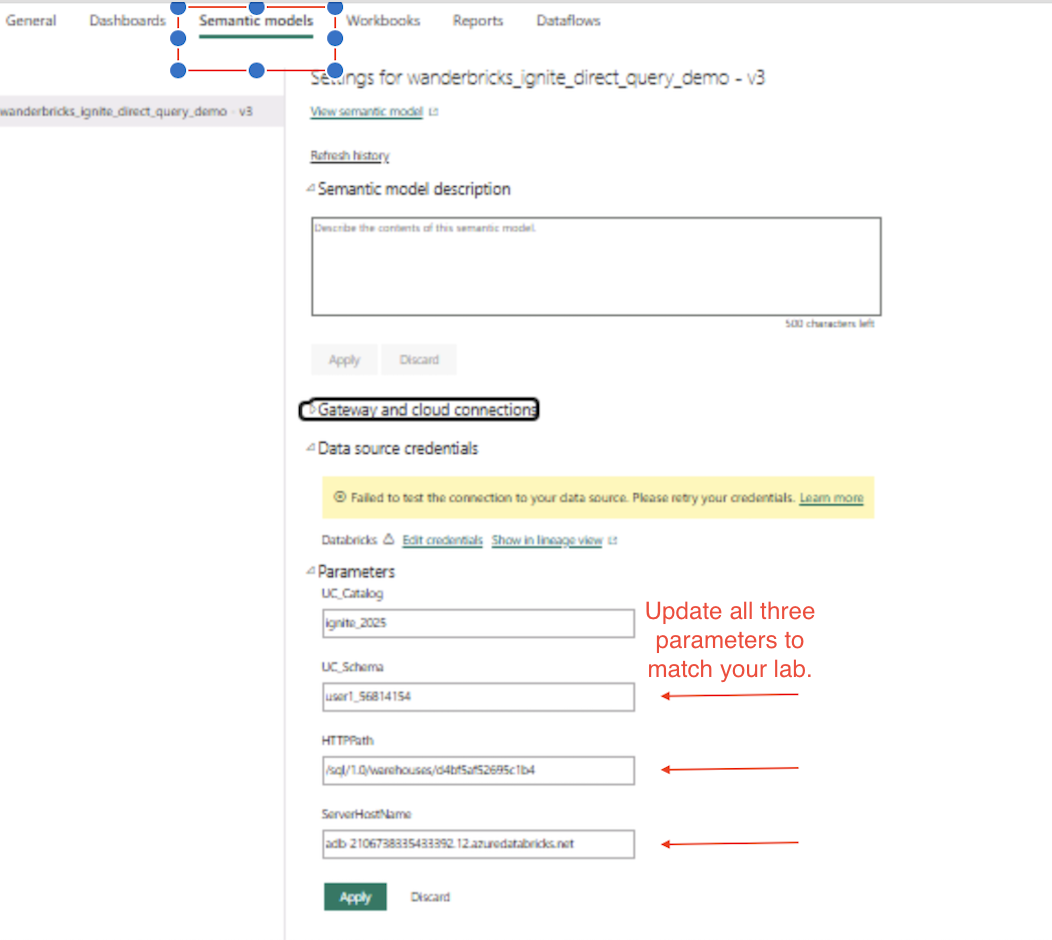
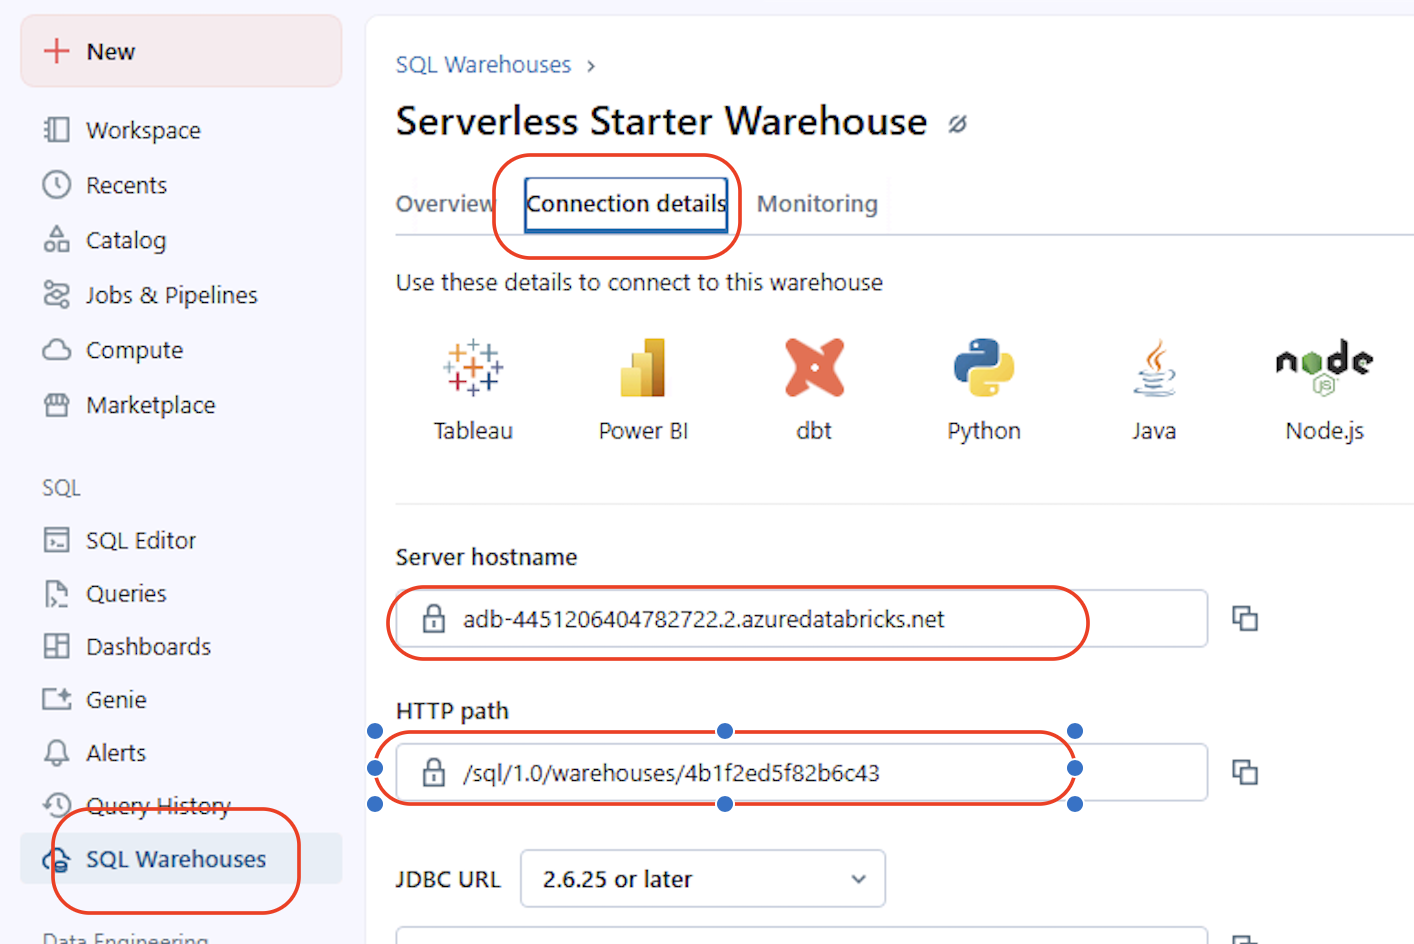
You can find ServerHostName and HTTPPath in Databricks under SQL Warehouses → (your warehouse) → Connection details.
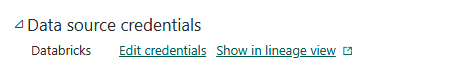
- In the same settings pane, locate Edit credentials.
- Choose OAuth2 as the authentication method.
- Sign in with your Databricks / organizational account as required.
- Open the imported report in Fabric.
- Interact with filters and visuals.
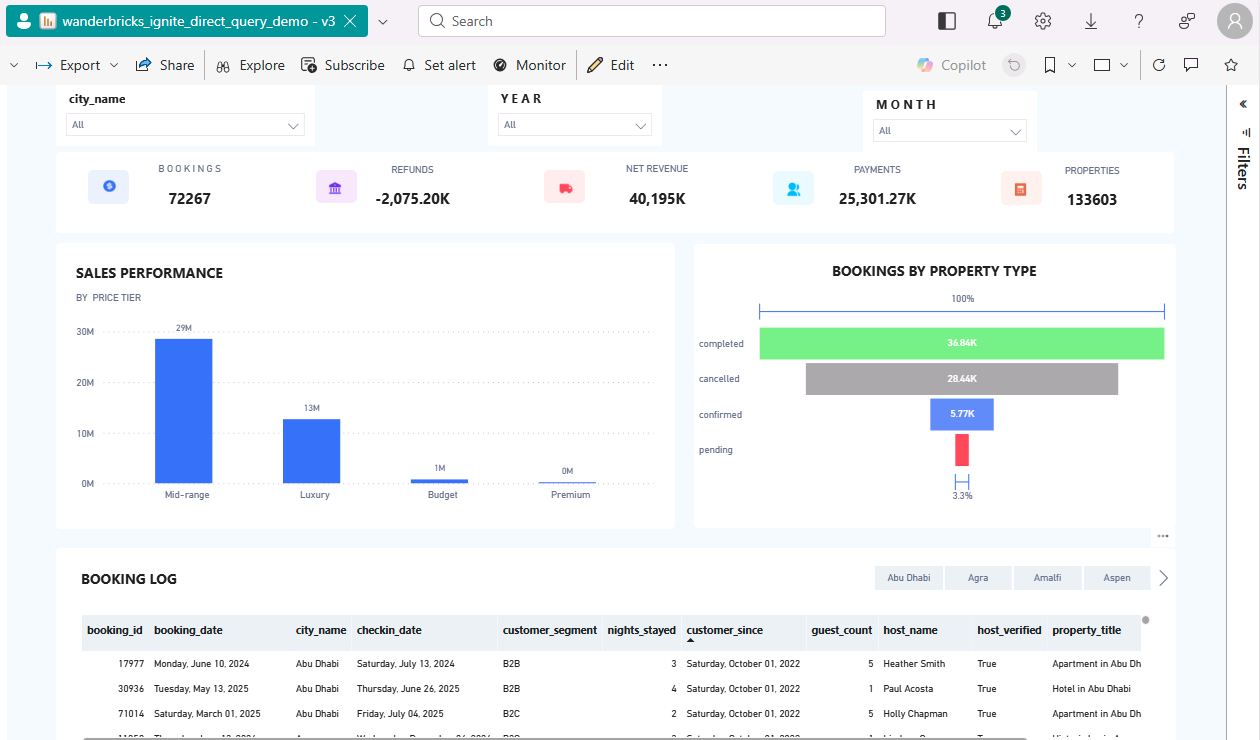
The report uses DirectQuery, so visuals are backed by live Databricks data.
[!Knowledge]
DirectQuery keeps the data in Databricks. Power BI sends queries at run time instead of importing data into the PBIX file.
===
In this final lab, you will explore the Wanderbricks production-style app deployed on Databricks Apps.
- In the Azure Databricks left sidebar, select Compute.
- Select the Apps tab.
- Confirm that wanderbricks-booking-app is Running.
- If not, start it and wait until the status is Running.
- Select wanderbricks-booking-app.
- Select Open app.
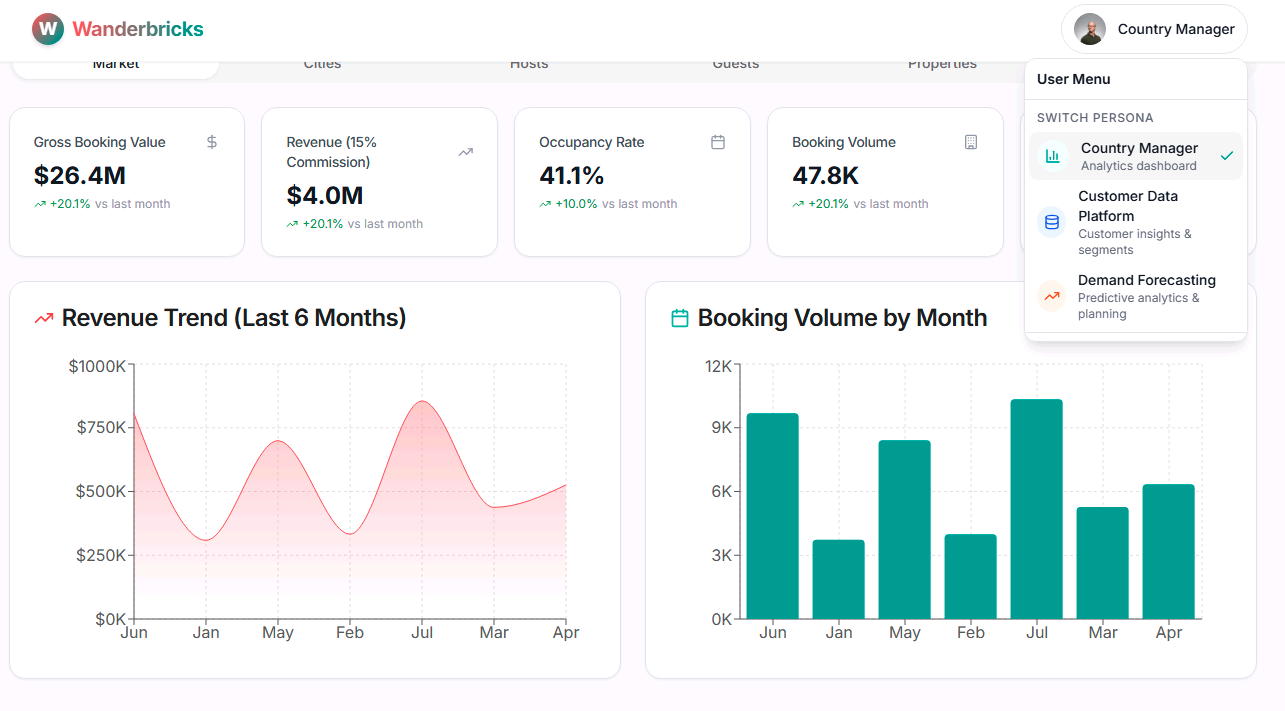
The app demonstrates three different persona experiences:
| Persona | Implementation | Data Source |
|---|---|---|
| Country Manager | Full stack (frontend + backend + database) | Real Databricks data via FastAPI backend |
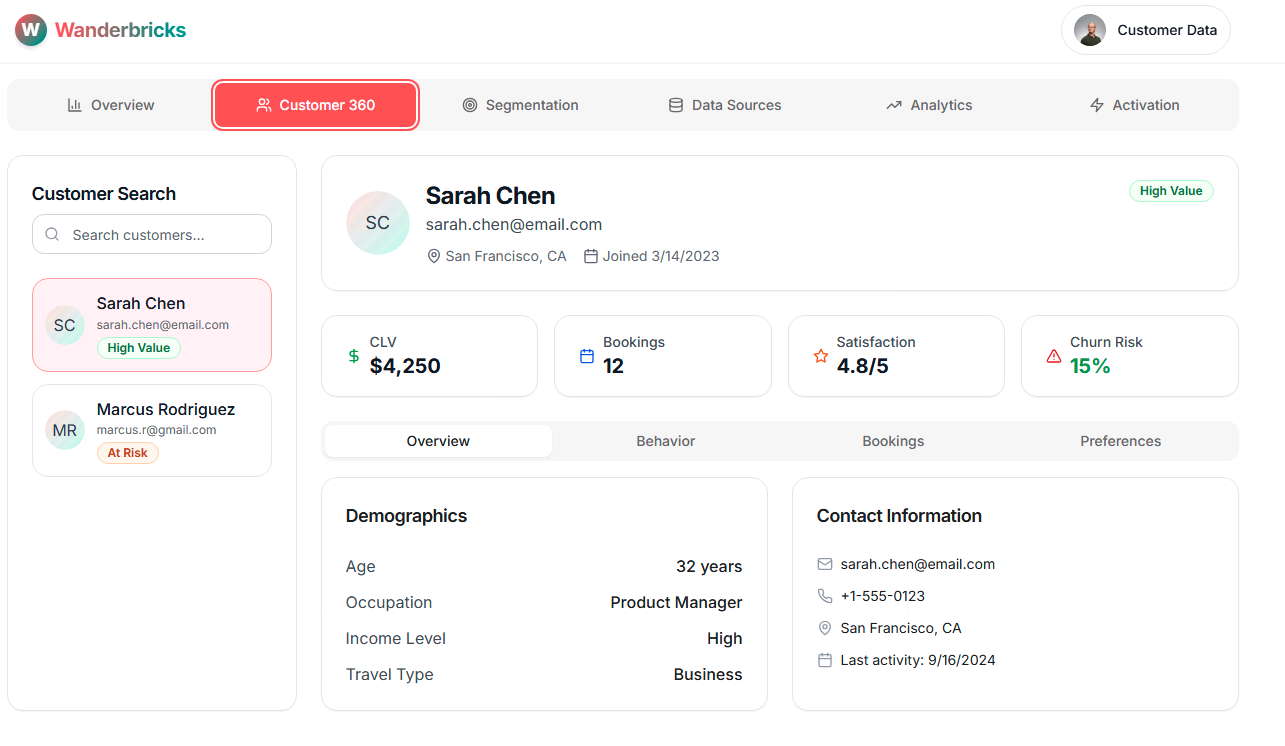
| Customer Data Platform (CDP) | Frontend only (no backend) | Static hardcoded sample data |
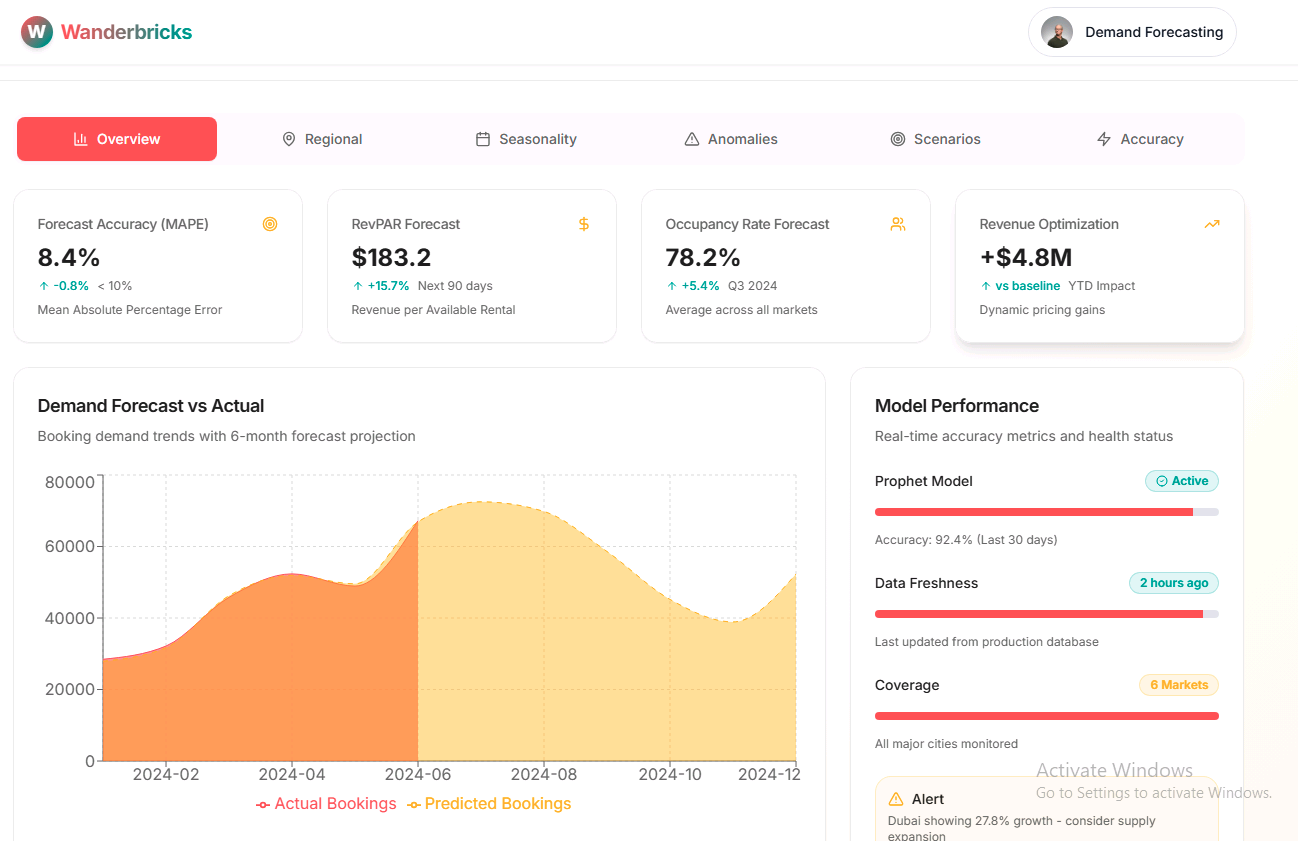
| Demand Forecasting | Frontend only (no backend) | Static hardcoded sample data |
Country Manager Dashboard - full-stack, powered by your Lakeflow pipeline data:
Customer Data Platform (CDP) - frontend-only, static sample data:
Demand Forecasting - frontend-only, static sample data:
In the app UI, explore the following:
-
Property search and filtering
Search for properties by country, city, and date range. -
Manager views
Review booking, revenue, and performance dashboards designed for a regional or country manager persona.
[!Hint]
This app demonstrates how a full-stack production experience can be hosted directly on Databricks, close to the data and AI workloads.
If you want to see how the backend is implemented:
- lab/05-app/backend/main.py - FastAPI entrypoints
- lab/05-app/backend/app/routers/dashboard.py - dashboard routes and logic
- lab/05-app/backend/genie/client.py - Genie / AI integration
- Frontend assets live under lab/05-app/backend/static/.
You have successfully completed this lab when:
- The Lakeflow pipeline runs successfully and builds the dimension and fact tables.
- The wanderbricks_bookings_metrics metric view is created.
- The Wanderbricks Bookings Dashboard displays data and responds to filters.
- Genie answers natural language questions against your metric view.
- The Power BI report connects to Databricks via DirectQuery (if Fabric is available).
- The wanderbricks-booking-app opens and loads data for at least one persona.
===
You have now:
- Deployed a lakehouse-style data platform using Lakeflow
- Applied governance and semantic modeling with Unity Catalog and Metric Views
- Enabled AI-powered analytics with Genie and AI/BI Dashboards
- Connected Databricks data to Power BI using DirectQuery (where available)
- Explored a production-style Databricks App running directly on the platform
- Extend the Lakeflow pipeline with additional dimensions or fact tables.
- Add new measures and dimensions to the metric view and refresh the dashboard.
- Customize dashboard filters and visuals to match your own KPIs.
- Experiment with additional Genie questions and review the generated SQL.
- Review the app source code in the repo to understand the FastAPI and React implementation.
[!Help]
If you experience issues with the lab environment, contact your instructor or support team for assistance.