I was studying this course on Integration when I encountered slope fields and I found them interesting!
So I thought I would give it a shot and try to write a program to draw slope fields myself! In order to read a mathematical function definition from input, I wrote mathexpr.
If you haven't already, install Haskell Platform.
git clone https://github.com/mdibaiee/slope-field
cd slope-field
stack install
slope-field
Parameters:
- dy/dx: derivative of the function you are trying to visualize
- range: range of numbers to draw
- estimation size: size of
deltaxwhich is used to draw the slope corresponding to a small point,0.03is usually a good number, but you might want to try out larger numbers to get a more detailed picture on some examples
dy/dx =
x + y
range - format: (lower, upper):
(-10, 10)
estimation size:
0.03

dy/dx =
x * y
range - format: (lower, upper):
(-10, 10)
estimation size:
0.03
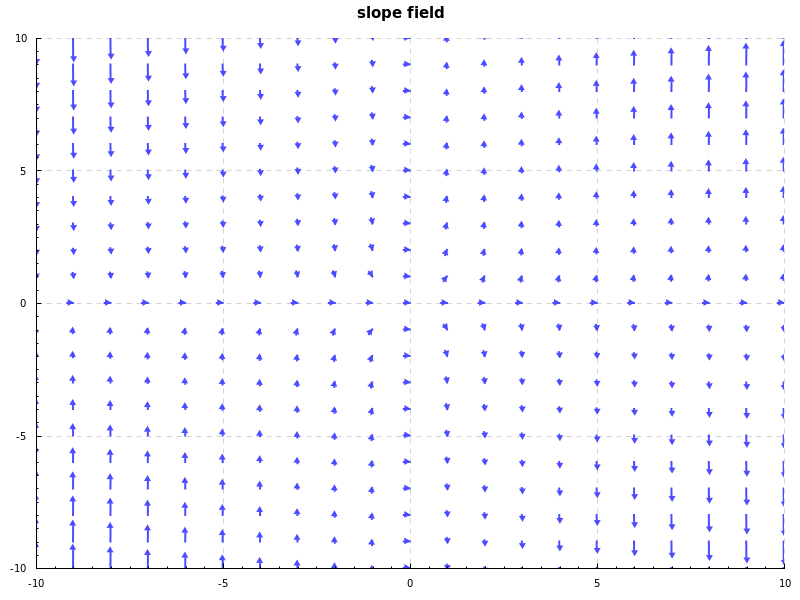
dy/dx =
-y
range - format: (lower, upper):
(-10, 10)
estimation size:
0.03

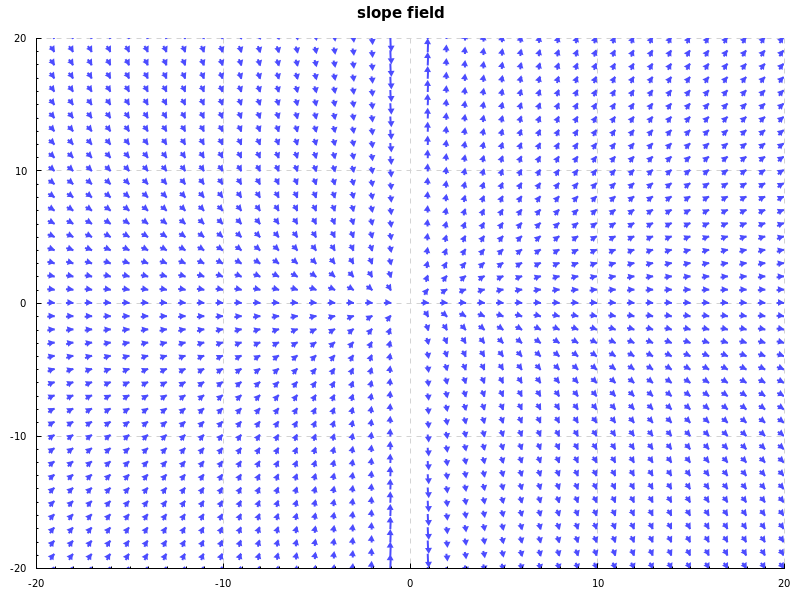
dy/dx =
y/x
range - format: (lower, upper):
(-20, 20)
estimation size:
0.1