Skip to content

plotting templates and utilities for data visualisation

License

Notifications You must be signed in to change notification settings

martok/py-plotkit

Folders and files

NameName
Last commit message
Last commit date

Latest commit


History

25 Commits


Repository files navigation

PlotKit

Collection of some helpers and functions, mostly used by martok.

Installation

Install using pip:

pip install mplotkit

Usage

Minimal example:

import numpy as np
import plotkit.plotkit as pk

pk.set_style('print')

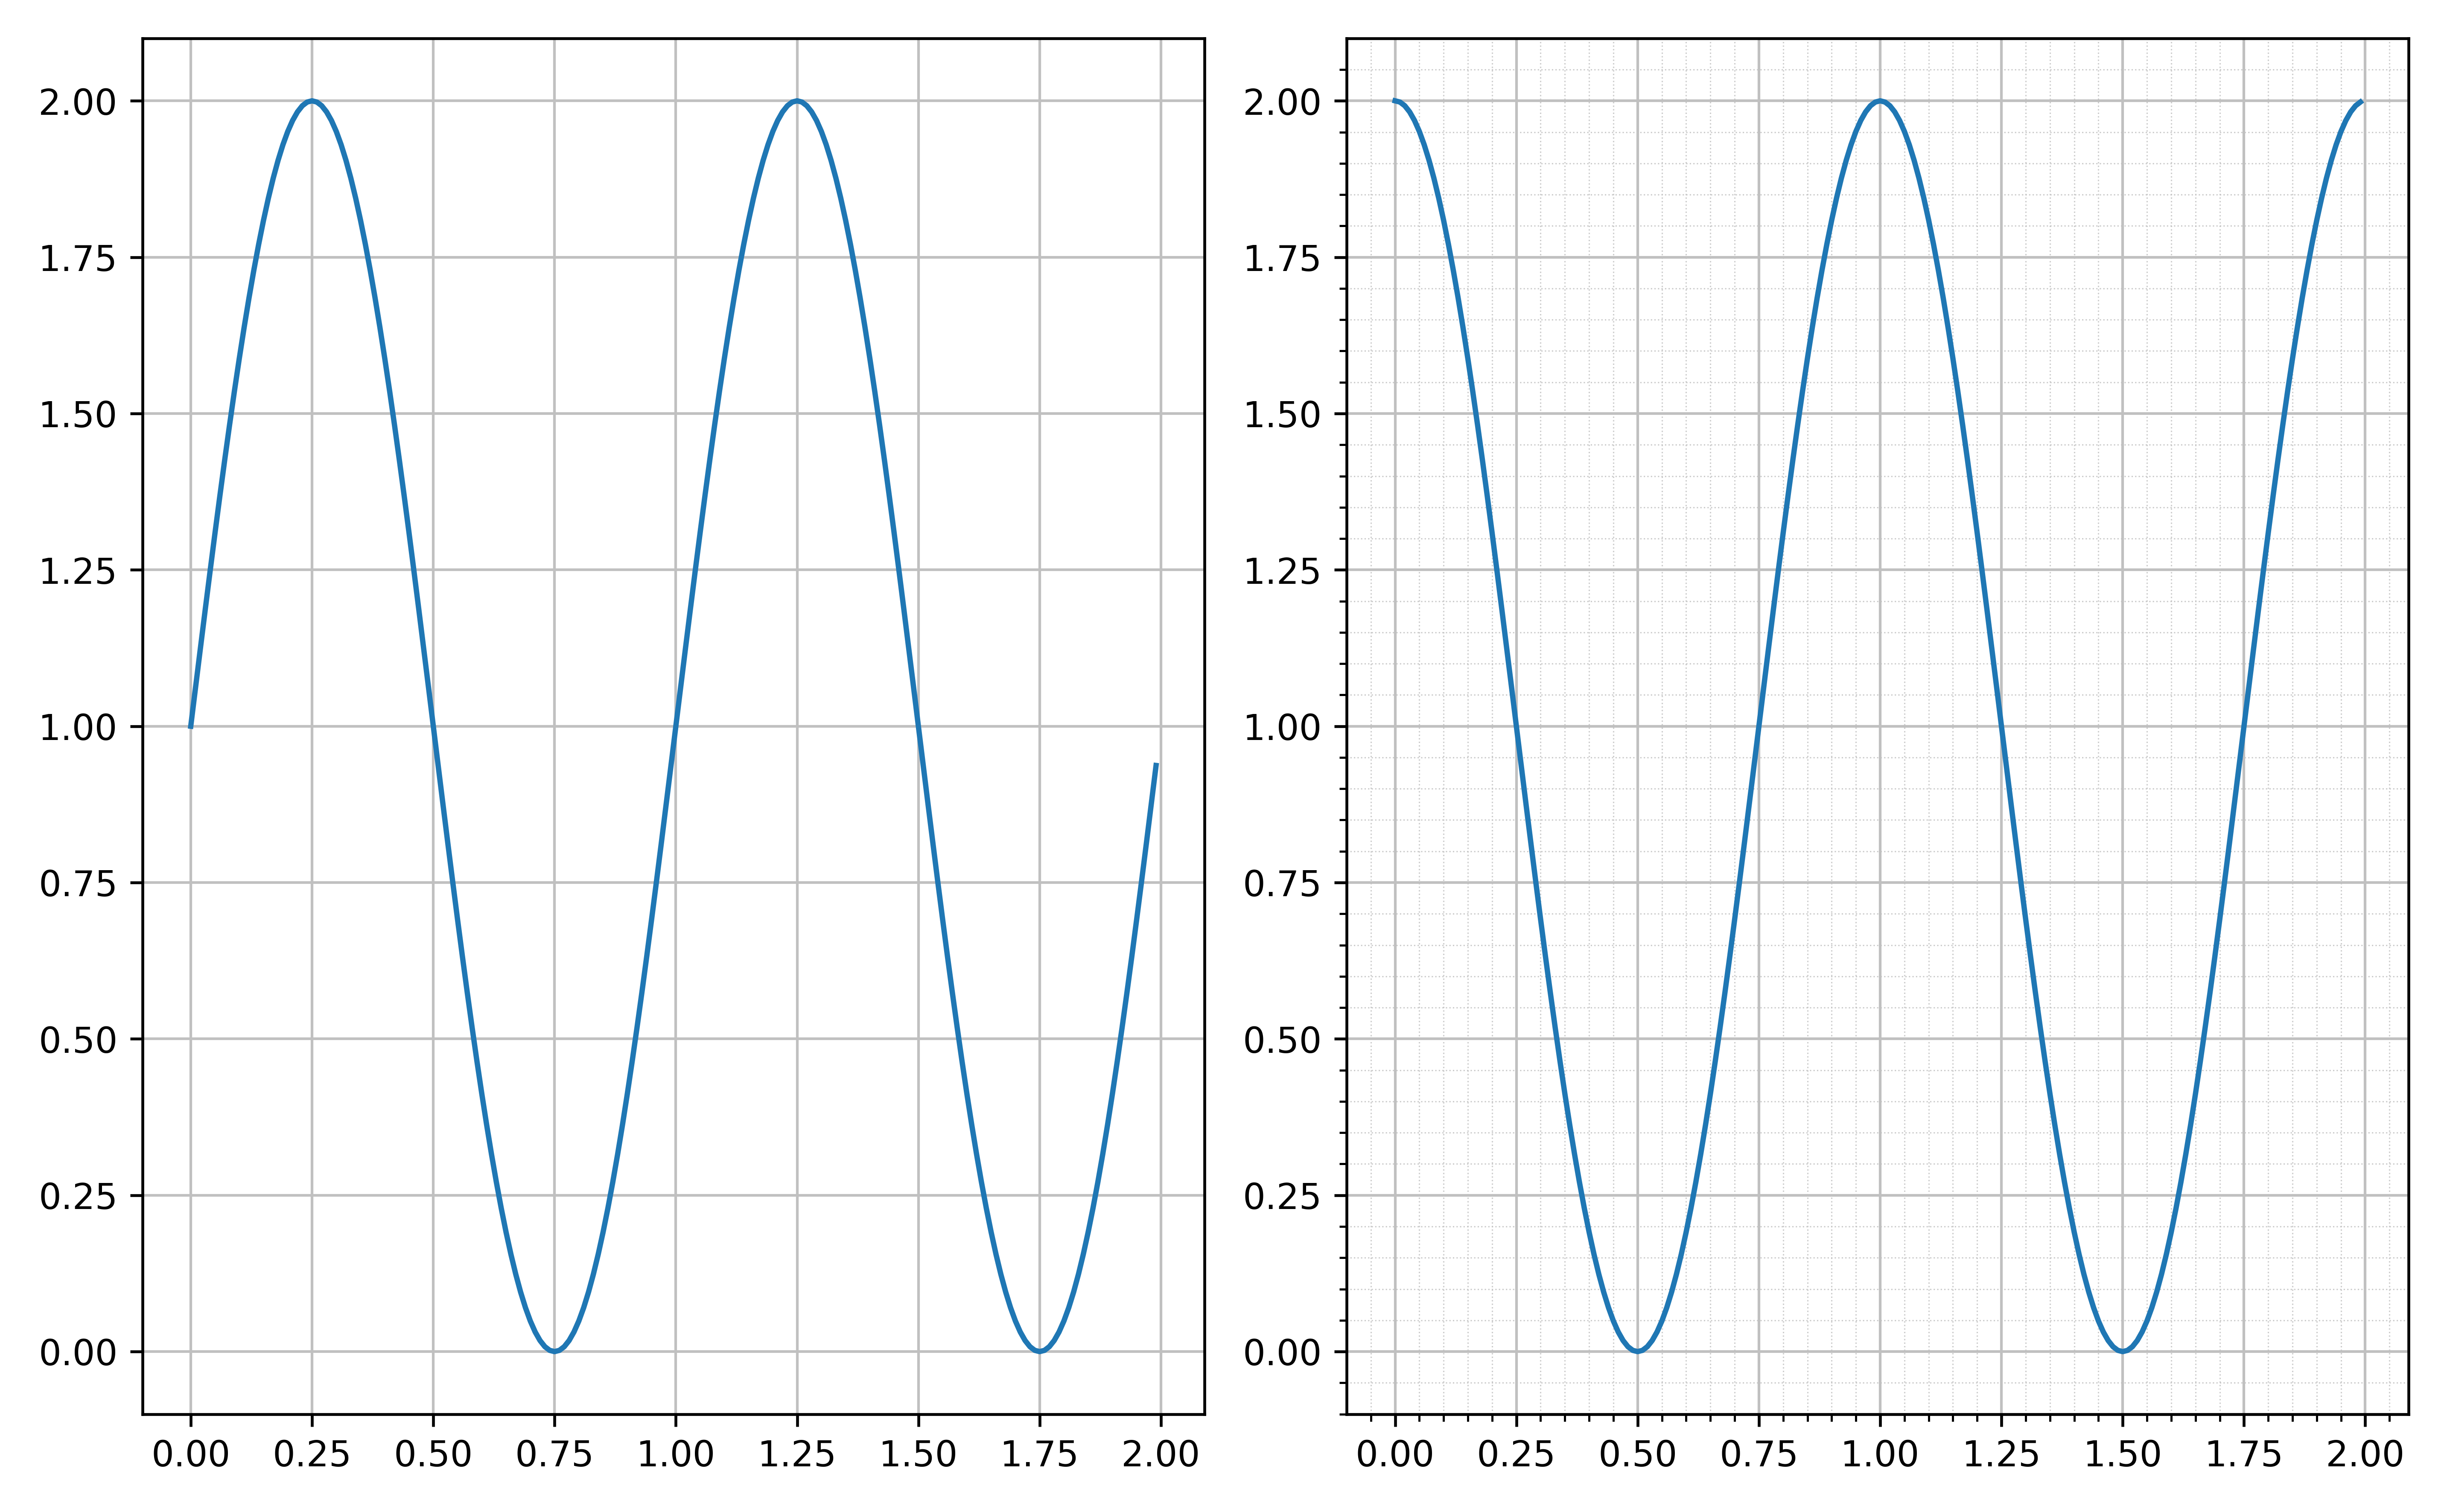
fig, (ax1, ax2) = pk.new_regular(1,2)
t = np.arange(0.0, 2.0, 0.01)
ax1.plot(t, 1 + np.sin(2*np.pi*t))
pk.set_grid(ax1)
ax2.plot(t, 1 + np.cos(2*np.pi*t))
pk.set_ticks(ax2)
pk.set_grid(ax2)
pk.finalize(fig, 'example_output.png')

Result: Example Output

About

plotting templates and utilities for data visualisation

Resources

License

Stars

Watchers

Forks

Releases

No releases published

Packages

No packages published