This is a workshop for JavaScript developers who want to deploy scrolly-telling apps like these using Scrollama:
Pre-requisites: You need familiarity with JavaScript and creating charts.
In this workshop, you'll build a simple scrolly-telling app that smoothly morphs a chart and tells a story.
STEP 1: Log into Codepen and Create a new pen titled Scrollytelling workshop
STEP 2: Add this HTML:
<link
  href="https://cdn.jsdelivr.net/npm/[email protected]/dist/css/bootstrap.min.css"
  rel="stylesheet"
/>

<div class="container">
  <h1 class="display-1 text-center">Scrollytelling</h1>
  <main class="row">
    <article class="steps col-6 col-lg-4">
      <div class="step py-5 px-3"><h2>Preamble</h2></div>
      <div class="step py-5 px-3"><h2>Story 1</h2></div>
      <div class="step py-5 px-3"><h2>Story 2</h2></div>
      <div class="step py-5 px-3"><h2>Story 3</h2></div>
      <div class="step py-5 px-3"><h2>Story 4</h2></div>
    </article>
    <section class="figures col-6 col-lg-8 position-sticky">
      <svg viewBox="0 0 600 600" class="bg-light network"></svg>
    </section>
  </main>
  <footer class="display-1 text-center my-5 py-5">Designed by Gramener</footer>
</div>

<script src="https://cdn.jsdelivr.net/npm/scrollama"></script>
<script src="https://cdn.jsdelivr.net/npm/[email protected]/dist/js/bootstrap.bundle.min.js"></script>
STEP 3: Add this CSS:
.step {
  min-height: 60vh; /* Space out the steps */
  opacity: 0.2; /* Hide all steps */
}
.step.active {
  opacity: 1; /* Show the active step */
}
.figures {
  /* Use full height */
  top: 0;
  height: 100vh;
  /* Vertically center content */
  display: flex;
  flex-direction: column;
  justify-content: center;
}
STEP 1: Add this code to the JavaScript section of CodePen to set up scrollytelling.
let scroller;

function render() {
  if (scroller) scroller.destroy();
  scroller = scrollama()
    .setup({ step: ".step" })
    .onStepEnter(drawFigure)
    .onStepExit(({ element }) => element.classList.remove("text-bg-success"));
  scroller.disable();
  scroller.enable();
}

async function drawFigure({ element }) {
  document
    .querySelectorAll(".step")
    .forEach((el) => el.classList.toggle("active", el == element));
}

render();
new bootstrap.Tooltip(".network", {
  selector: '[data-bs-toggle="tooltip"]',
  container: ".figures",
});
Now, as you scroll, the sections on the left will be highlighted.
STEP 1: Add this code to the start of the JavaScrpt seection. This loads the network chart and the data.
import { network } from "https://cdn.jsdelivr.net/npm/@gramex/[email protected]";
import * as d3 from "https://cdn.jsdelivr.net/npm/d3@7/+esm";

const { nodes, links } = await fetch(
  "https://gramener.com/charts/gramener.json",
).then((r) => r.json());
const color = d3.scaleOrdinal(d3.schemePaired);
STEP 2: Add this code at the end of drawFigure().
const graph = await network(".network", {
nodes,
links: links.filter((d) => d.hours > 3),
});
graph.nodes.attr("fill", "red").attr("r", 4);
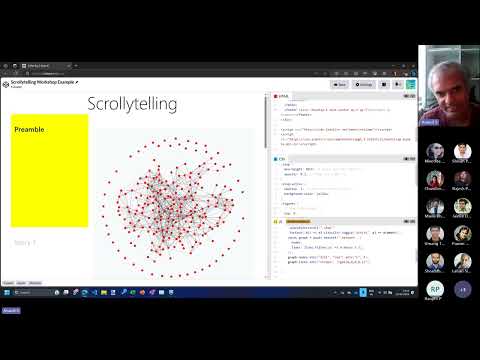
graph.links.attr("stroke", "rgba(0,0,0,0.2)");You should see a network like this on the right:

STEP 1: Replace the <article> HTML with the code below.
<article class="steps col-6 col-lg-4">
  <div class="step py-5 px-3" data-params='{"minHours": 999}'>
    <h2>These are Gramener people</h2>
    <p>Each circle represents 1 person in Gramener.</p>
  </div>
  <div class="step py-5 px-3" data-params='{"minHours": 0.167}'>
    <h2>Some are isolated</h2>
    <p>Most people spend at least 10 min connecting with others in a week.</p>
    <p>But a few spent less than 10 minutes with others.</p>
  </div>
  <div
    class="step py-5 px-3"
    data-params='{"minHours": 0.167, "fillBy": "team"}'
  >
    <h2>Mostly in Tech CoE</h2>
    <p>Colors represent different teams.</p>
    <p>The isolated ones are mostly from the Tech CoE</p>
  </div>
  <div class="step py-5 px-3" data-params='{"minHours": 4, "fillBy": "team"}'>
    <h2>Teams work together</h2>
    <p>
      When we connect people spending 4+ hours with each other, you see
      team-wise clusters (same-color).
    </p>
  </div>
  <div class="step py-5 px-3" data-params='{"minHours": -1, "fillBy": "team"}'>
    <h2>Let's connect Gramener</h2>
  </div>
</article>
STEP 2: Replace drawFigure() with the code below.
async function drawFigure({ element }) {
  document
    .querySelectorAll(".step")
    .forEach((el) => el.classList.toggle("active", el == element));

  // Get chart parameters for each step
  const { minHours, fillBy } = JSON.parse(element.dataset.params);
  // Render chart using those parameters
  const graph = await network(".network", {
    nodes,
    links: links.filter((d) => d.hours > minHours),
  });
  graph.nodes
    .attr("fill", fillBy ? (d) => color(d[fillBy]) : "red")
    .attr("r", 4)
    .attr("data-bs-toggle", "tooltip")
    .attr(
      "title",
      (d) => `${d.name} (${d.team} - ${d.band} - ${d.location} - ${d.gender})`,
    );
  graph.links.attr("stroke", "rgba(0,0,0,0.2)");
}
Scroll over the story. The visuals should change as you scroll, in line with the story.

STEP 1: Create your own new story from this data.
- Modify the parameters
- Modify the story text
- Add new steps
STEP 2: Test and save your CodePen
- Create an issue titled
Exercise submission. Add a link to your CodePen and submit the issue.
To mark a submission as correct:
- Check if the slider filters for the characters with the most power.
- Check if the code renders using
scrollama(). - Check if the story is different from the original and uses different
data-params.