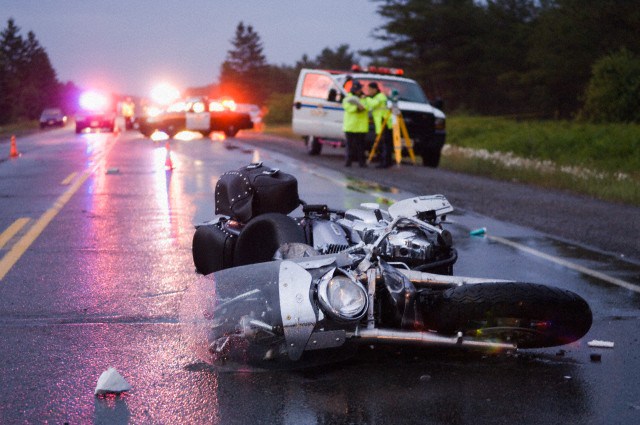
The dataset, titled "US_Accidents_March23.csv", contains information about car accidents across the United States up to March 2023. The data includes:
- Location details: City, state, and coordinates.
- Accident details: Severity, start and end times.
- Environmental features: Weather, road conditions, and more.
The primary goals of this project are:
- Clean and preprocess the dataset for analysis.
- Sample a subset of 10,000 rows for quick exploration.
- Ensure datetime consistency for time-related columns (Start_Time and End_Time).
- Perform initial analysis to highlight accident trends.
The dataset was loaded into a pandas DataFrame:
import pandas as pd
file_path = r"US_Accidents_March23.csv"
df = pd.read_csv(file_path)To ensure clean and reliable data:
- Rows with missing (NA) values were dropped:
df_no_na = df.dropna()This step ensures that only complete rows are used for analysis.
From the cleaned dataset, a random sample of 10,000 rows was selected:
cleaned_accidents = df_no_na.sample(n=10000, random_state=42)random_state=42ensures reproducibility of the sample.
Columns Start_Time and End_Time were converted to datetime format:
cleaned_accidents['Start_Time'] = pd.to_datetime(cleaned_accidents['Start_Time'])
cleaned_accidents['End_Time'] = pd.to_datetime(cleaned_accidents['End_Time'])
This step ensures accurate handling of date and time values for trend analysis.
The cleaned dataset was saved for further use:
output_path = r"C:\Users\vange\Desktop\github project\cleaned_accidents.csv"
cleaned_accidents.to_csv(output_path, index=False)- The cleaned file is saved at:
C:\Users\vange\Desktop\github project\cleaned_accidents.csv
This project was a collaborative effort by:
- Georgios Birmpakos
- Vasileios Katsikas
- Evangelos Diaskoufis
- Objective: Identify the states with the highest and lowest accident counts.
- Insights: Highlight accident trends across states.
- Determine the state with the highest accident frequency.
- Analyze if there's a significant gap compared to other states.
- Goal: Examine seasonal trends in accidents.
- Identify peak months where accidents are most common.
- Analyze accidents near:
- Junctions
- Stop signs
- Traffic signals
- Calculate the percentage of total accidents occurring in these areas.
-
Accident Severity Analysis:
- Explore severity distribution across cities and states.
- Identify the most dangerous areas based on accident severity.
-
Temporal and Spatial Trends:
- Locate geographical hotspots for accidents.
- Analyze time-based trends:
- Peak accident hours
- Seasonal patterns (e.g., months or holidays).
This documentation outlines the key steps in cleaning and preparing the "US Accidents" dataset for analysis. The cleaned dataset, containing 10,000 sampled rows, is now ready for:
- Deeper analysis of accident severity and trends.
- Visualization of hotspots, time-based patterns, and critical accident locations.
Stay tuned for further insights and visualizations! 🚗💥

