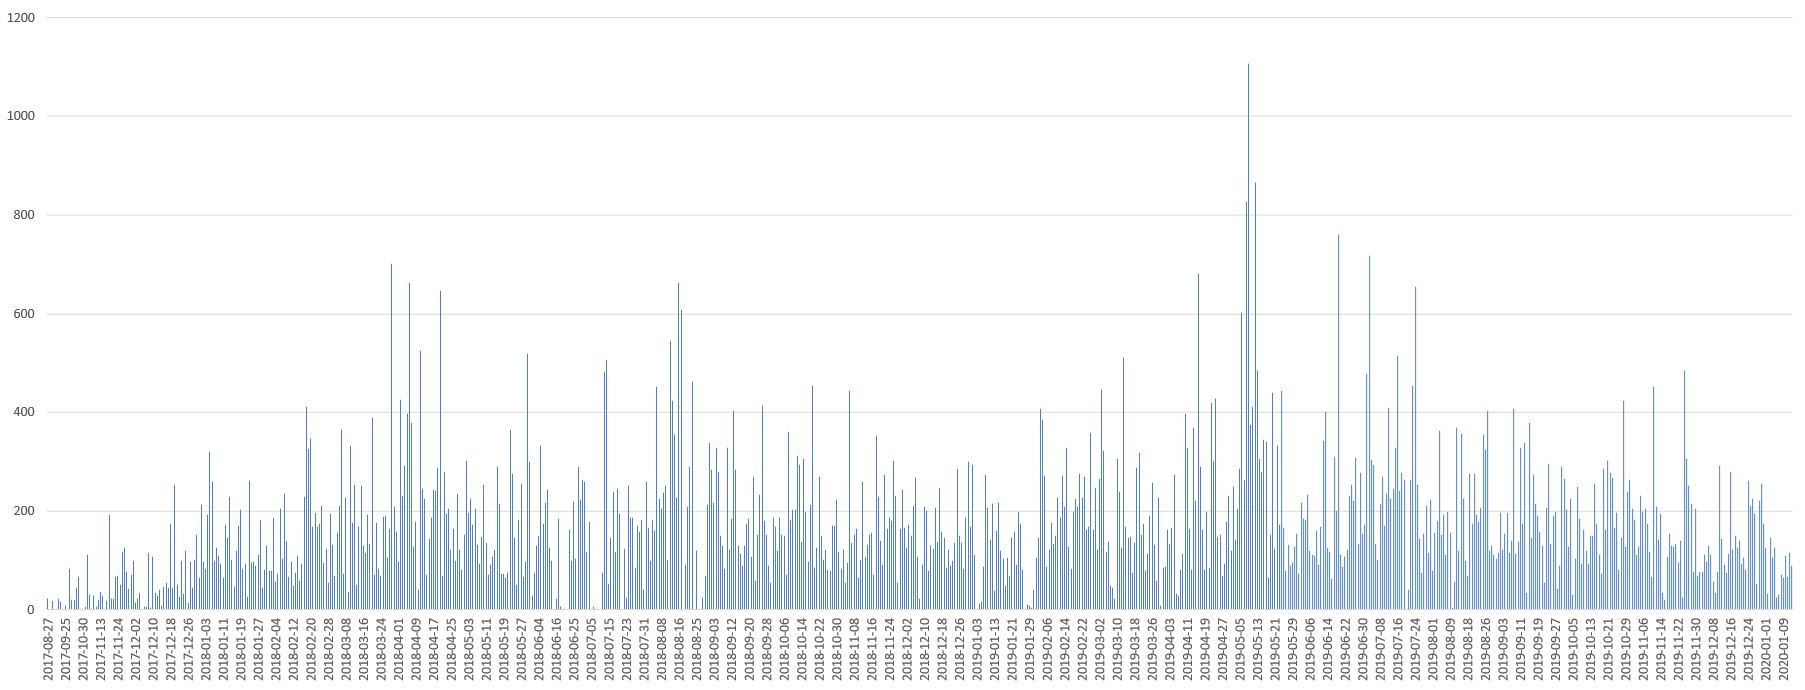
This module creates a graph based on chat data exported from Telegram. The graph shows amount of messages per day in one chat.
TAGS: Python, JSON, MatPlotLib, Pandas
{
 "about": "",
 "chats": {
  "about": "",
  "list": [
   {
    "name": "Person",
    "type": "personal_chat",
    "id": 123456789,
    "messages": [
     {
      "id": 1234,
      "type": "message",
      "date": "2017-08-27T20:15:06",
      "edited": "1970-01-01T05:00:00",
      "from": "Me",
      "from_id": 5647,
      "text": "Test"
     },