Botnets are groups of computers which are controlled by a malicious actor. They usually get infected by malware obtained from network connections. The user doesn’t notice this since the computer keeps working as usual, with the malicious software running on the background. Many of these malwares have the ability to self-propagate, and they infect additional computers via websites and Trojans.
Botnets are created in order to carry out a type of cyber-attack known as Distributed Denial-Of-Service (DDoS) attacks. The objective is to flood a server or infrastructure with many fake requests, until it is overwhelmed by the huge amount of malicious traffic and is unable to respond to the real traffic.
The key part to defend against DDoS attacks is to differentiate the real accesses from those generate by the botnet. Usually the attackers employ several mechanisms to make the traffic look legit, so that the targeted organization is not able to defend since they don’t know for sure which IP addresses are malicious.
Log files are one of the primary ways to observe and monitor network usage. They are computer generated files that contain records of events from softwares and operating systems. In a network Log file, the system can register the exact time of every connection or request, along with the IP of the source and target IP addresses. This is convenient in order to prevent attacks, because it is possible to detect unusual traffic coming from a group of computers. By analizing certain patterns in Log files, groups of attackers can be identified.
For this project, the Log file provided looks like this:
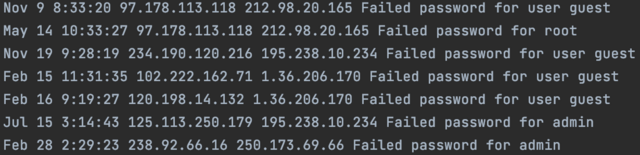
When there is a botnet attack, one computer makes several requests to the same server at the same moment of time, like in this case:
The header files in this repository are approriately commented and documented. The following is a conceptual explanation of the structures and mechanisms used to analyze the Log input.
In order to identify the attacks, it is necessary to store the connections in a data structure. It is useful to determine an Object Oriented representation of the problem. First of all, there are Nodes, which in this case are computers with a specific IP. There are also connections between the computers, and each connection has a Date and a number of occurrences.
The Graph data structure naturally allows to represent connections between different nodes in a network. It stores the information of each node in a vector, and in order to store the connections, an adjacency table is created. In this table, the rows represent sources while the columns are targets. Whenever there is a connection between to nodes, the slot obtained by the indexes of the source and the target are marked. This allows to represent directed connections.
One limitation that the graph has is that, typically, the number of nodes in the network must be known beforehand. In order to overcome this, the adjacency table was programmed to resize each time its capacity was reached in the doubleSize method, following the same principle as in resizing arrays (vectors).
However, this is not enough to solve the problem. Normally, an adjacency table only contains integers that indicate the weight of an Edge. In this case the timestamp forms an important part of the connection (almost its identifier). As there could be connections to the same target at several different times (all of them coming from the same source), there could be several Edges even between the same two nodes. Therefore, an Edge object was created, which stored a DateTime object pointer (the date and time of the connection), and the number of occurrences. The number of occurrences can be understood as the amount of requests from the source to the target in that particular instant. When this number was high in and Edge, there could have been an attack.
The adjacencies table was transformed so that each slot became a vector of Edge object pointers. This means that for a particular pair of source and target, there could be several connections at different times. The table could be understood as a three dimensional structure. The rows (length) corresponding to the sources, the columns (width) corresponding to the targets. Each slot is in reality a pointer to a vector, so it represents the depth. It is important to state that the number of edges is not fixed, so the slots have a variable depth each one, depending on the number of connections with distinct timestamp. This explains why in the ResizingVectorGraph , the adjacencies attribute was define as a triple pointer.
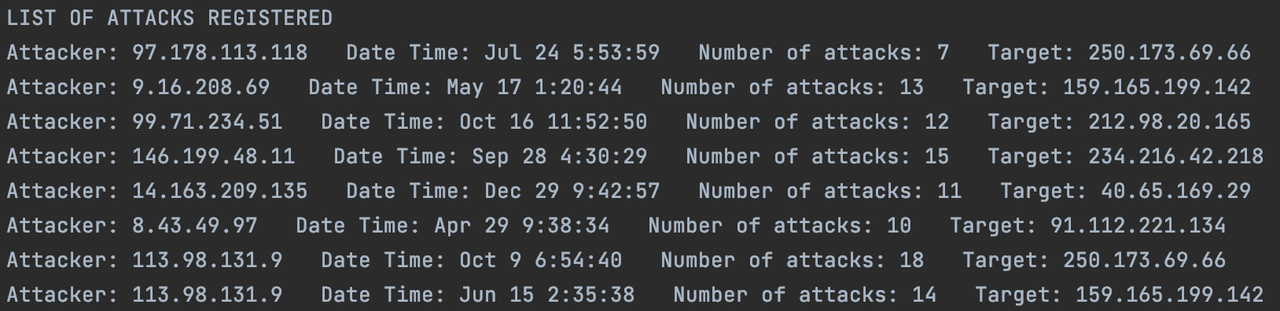
By using this modified structure, it is possible to identify attackers and print them to an output file ("attacks.txt"). This report shows all the potential attacks that happened in the network, stating the attacker IP, the date time, the number of attacks (i.e. the number of unsuccessful accesses or the weight of that particular edge), and the target IP.
Further observation of the report generated by the Graph Data Structure shows that there is a pattern which was not identified. There are some sources that attacked the same target. This is of particular importance since it allows to identify the bots in the botnet which are targeting a specific server, and to block them from the network or make a deeper analysis on their behavior.
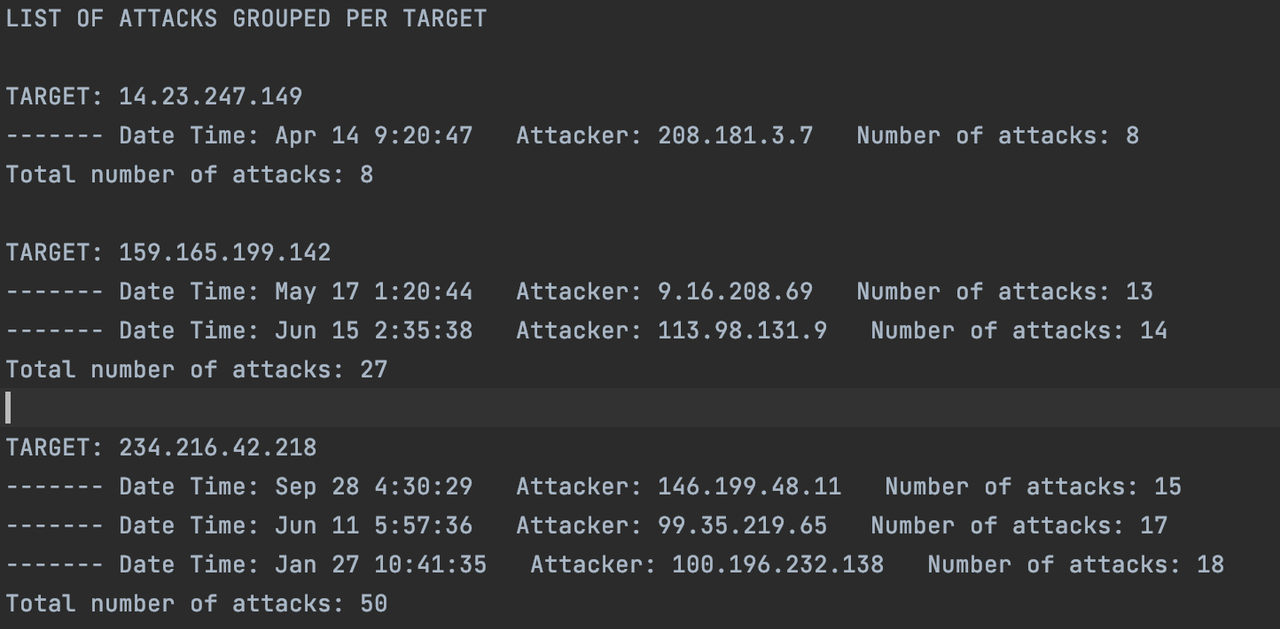
Once the attacks were identified, it is only necessary to group them according to the target. The optimal data structure to do this is the hash table, since it allows to insert items by key, which is not necessarily numeric. There can also be more than one elements with the same key. In this case, the key would be the IP address of the target, and each one of the elements would be a tuple representing the attack (source, edge, target). In order to implement this, the C++ std::multimap struture was used, since it allows to have multiple entries for the same key. The function printGroupedAttacks takes the graph, creates a multimap with the entries and then prints the attackers grouped by target in the "groupedAttacks.txt" file. The report looks like this: