This program is a graphical workbench for creating and manipulating graphs and running JavaScript on them to automate a variety of calculations.
Possible applications include typesetting graphs for academic papers and presentations (it exports to TikZ), looking for counterexamples to conjectures and testing graph algorithms.
You are looking at an early release, and a lot of features and polish are still missing. I am grateful for any bug reports, pull requests, feature suggestions and other feedback.
The easiest way to use this program is to pull one of the binary builds (version 0.4.1 of 2018-03-20):
Once you have unpacked the relevant package, switch into the directory contained and run the binary (./gdepictions in a Linux shell, or gdepictions.exe on Windows).
On Linux, you additionally require
- a version of libv8 (>= 3.14.5 or thereabouts, as found in the Debian and Ubuntu repositories as
libv8-3.14.5) zenityfor save/load dialogs. The Windows build includes the required DLLs.
You may also try to compile it yourself, which may involve some effort. In fact, natively creating a Windows binary of the old version of V8 that graphic depictions is based on turned out to be so painful that I gave up and cross-compiled everything using mingw-w64. If you are not discouraged, consult the "How to compile from source" section further below.
The program uses a Blender-inspired modal keyboard-and-mouse interface. Most actions are performed by pressing some key or key combination to initiate an action at the mouse position. When more input is necessary (e.g. a second endpoint for a new edge, or the other corner of a box selection), the action can be completed by moving the mouse and either committing the results by clicking or cancelling by pressing Escape. The state in which no complex action is awaiting more input shall be referred to as neutral mode.
The following list of examples doubles as an outline of basic workflow:
Vto create a selected vertex at the current cursor position.Cto connect all selected vertices with edges.Eto initiate an edge at the vertex closest to the mouse cursor. A dangling edge will be drawn from the vertex to the mouse cursor to indicate that an edge is currently being added. Once another vertex is clicked, the interface returns to neutral mode and an edge is added between the two vertices. Alternatively, pressingEagain adds the edge and initiates a new edge at the target vertex.Binitiates a selection box at the current location of the mouse pointer. When the left mouse button is clicked, all vertices in a square region between whereBwas pressed and the mouse was clicked are selected.Aunselects all vertices when vertices are selected, and selects all vertices when none are selected.- A left mouse button click in neutral mode selects the vertex closest to the mouse cursor. If
Shiftis held, the vertex is instead added to the current selection. - A right mouse button click in neutral mode opens the context menu.
Ddeletes all edges between selected vertices.Ginitiates moving of the currently selected vertices by moving the mouse pointer. Click the graph view with the left mouse button to place the vertices at their current location, or pressEscto cancel.Xextrudes the currently selected vertices, that is, it duplicates the subgraph induced by them and connects each new node to the respective old node that gave rise to it. PressingXautomatically initiatesGo mode on the new vertices.
The camera may be manipulated in a variety of ways.
- To pan (slide) the graph, hold and drag the middle mouse button or mouse wheel, or alternatively use the arrow keys.
- To zoom in and out, roll the mouse wheel up or down respectively.
- When operating in 3D mode (Layout > Unlock 3D), hold and drag the right mouse button to rotate the view in space.
- When a nonzero number of vertices is selected, press
Mto center the view on the selected vertices.
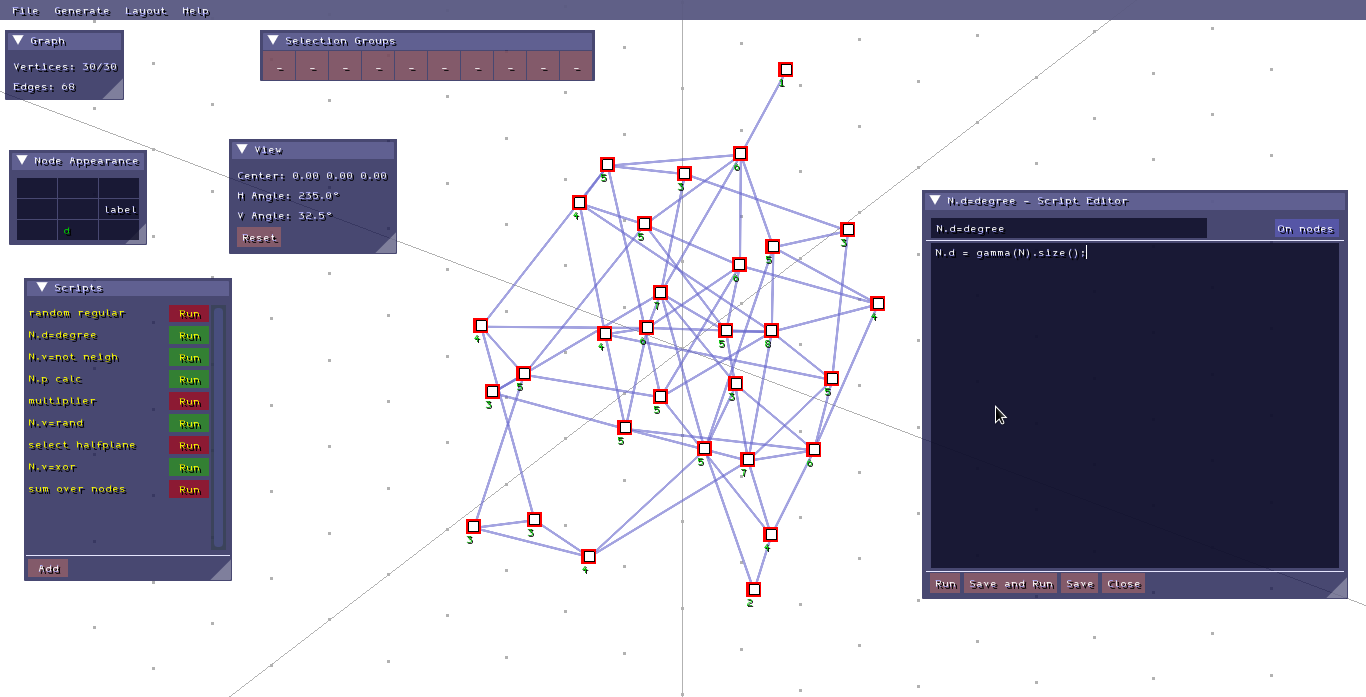
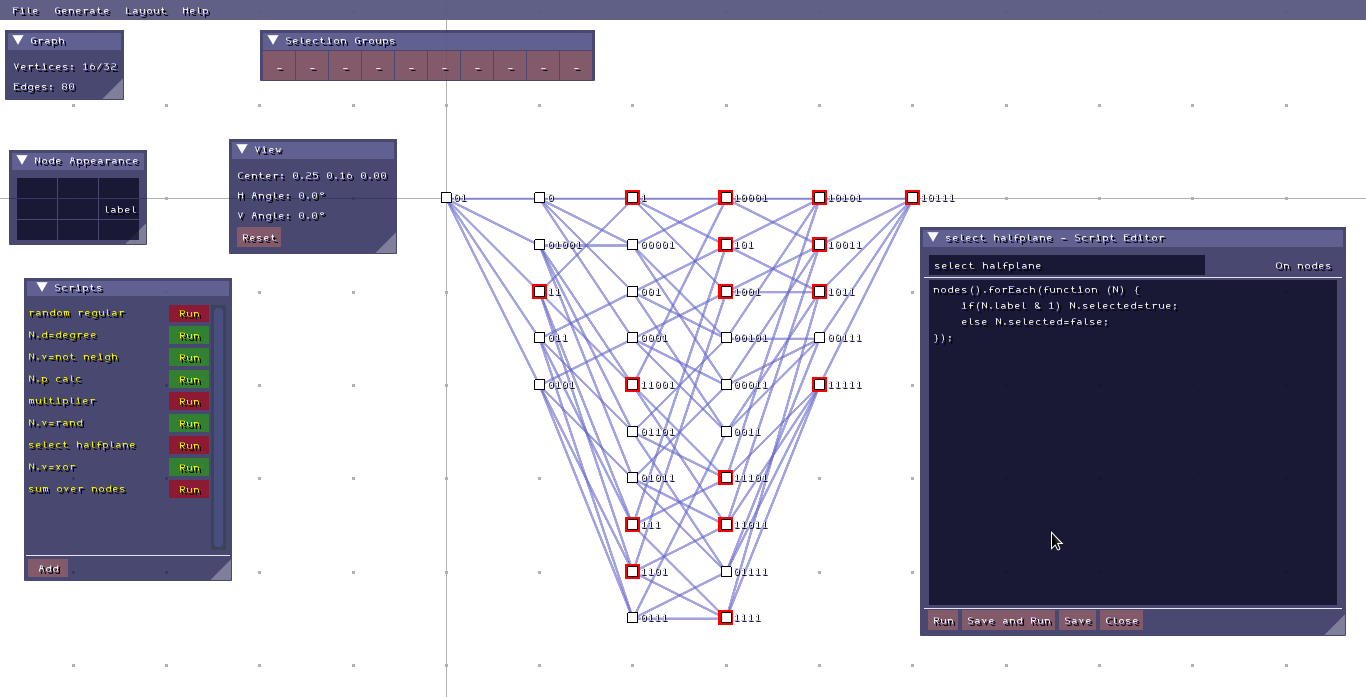
A key feature of graphic depictions is the ability to run JavaScript programs on the graph. To create a script, press the Add button in the Scripts window, and click on the New script entry that is created in the list. A script can either be applied to each selected node (default) or the whole graph (disable the on nodes option in the script editor). A few example scripts are included with the distribution, and if you are already familiar with JavaScript, these may be the fastest way to familiarise yourself with the environment. The important basics are the following:
- When running on nodes, the current node is made available locally as an object named
N. This object can store arbitrary data, so for instance the scriptN.v=3;creates an attribute namedvin every node that is selected when it is run and assigns the integer3to it. If the scriptN.v = N.v * N.v;is then run on a subset of those nodes, the nodes it will run on will have their attributevset to9. - Nodes also have a special boolean attribute
selectedwhich is true iff the node in question is currently selected. - If
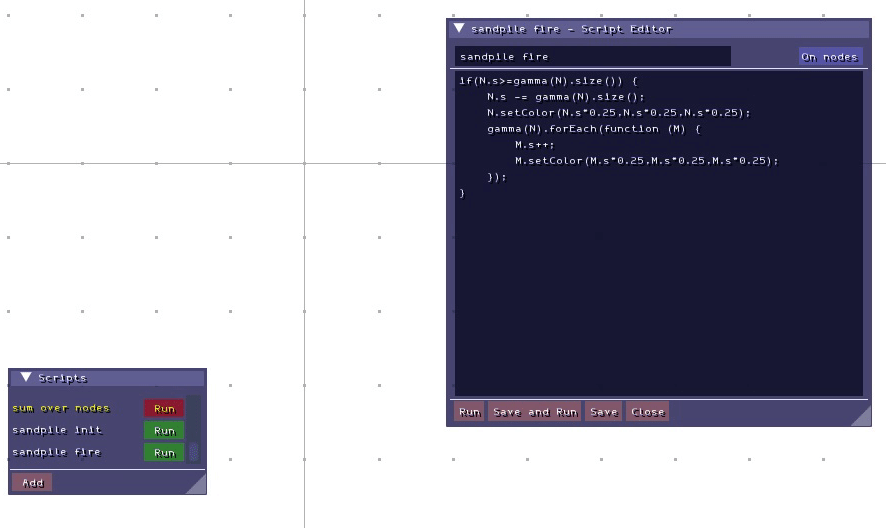
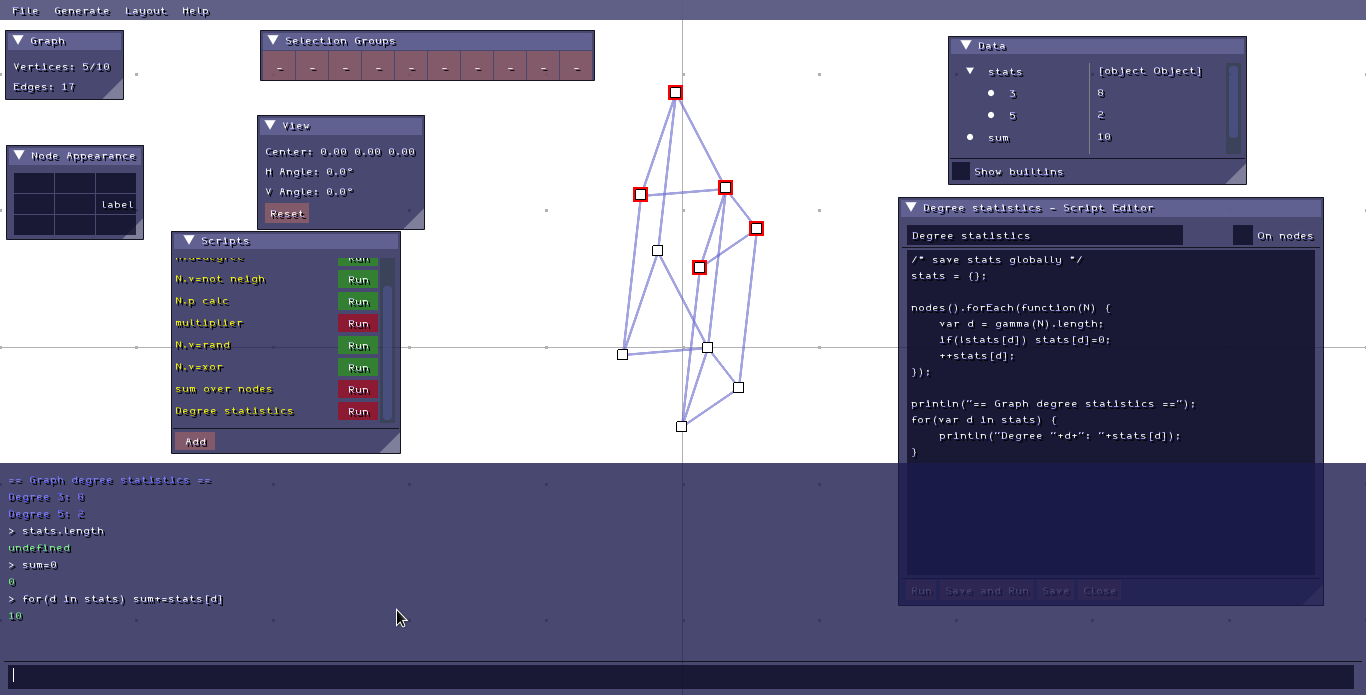
Nis a node object, thengamma(N)is the array of nodes in the node's neighbourhood, that is, all nodes connected to it, not including itself. This set can be iterated over as follows:
gamma(N).forEach(function (M) {
    M.selected = true;
});
This script adds all nodes that are adjacent to N to the current selection.
- If
Nis a node object, thendelta(N)is an array of edges on the node's boundary, that is, all edges incident to it. This set can be iterated over as follows:
delta(N).forEach(function (E) {
    // Get other end.
    // + forces comparison of underlying nodes rather than references.
    var M;
    if(E.n1 ==+ N)
        M = E.n2;
    else
        M = E.n1;

    // label edges incident to N with difference in v going out of N
    E.label = M.v - N.v;
});- The set of all nodes is always made available as an array in global scope as
nodes(). So the action of a script "on nodes" can be emulated with a script "on graphs" as follows:
nodes().forEach(function (N) {
    if(N.selected) {
        // script here
    }
});
Likewise, the set of all edges is made available as edges().
- New nodes and edges can be added by scripts using
addNodeandaddEdge. When adding nodes, the position in 2D or 3D space needs to be specified. For instance, the following script creates a new dangling vertex that is connected to each vertex in the selection next to the respective vertex:
M = addNode(N.pos.x+0.1, N.pos.y); // or addNode(N.pos.x+0.1, N.pos.y, N.pos.z)
E = addEdge(M,N);getEdge(M,N)returns a handle to the edge betweenNandMif there is one, andundefinedotherwise.- Existing nodes and edges can be deleted with
delNodeanddelEdgerespectively. All references to a deleted node or edge in global scope are rendered undefined by this. However, it is the user's responsibility to ensure that local references and those stored in closures are disposed of properly.
addNode(0,0);
addNode(0.1,0.1);
E = addEdge(nodes()[0], nodes()[1]);
var Elocal = E;
delEdge(nodes()[0], nodes()[1]); // Also ok: delEdge(E);
// E is now undefined
// Elocal is now toxic sludge and should not be read
delNode(nodes()[0]);printandprintlncan be used to print any single value to the console (opened withTab), potentially creating a new line.- The display colour of a node
Ncan be adjusted by callingN.setColo(u)r. By default, nodes are drawn white.
N = addNode(0,0);   // add node at origin
N.setColor(1.0,0.0,0.0); // make it red- In addition, all builtins of the ECMAScript 5 standard, e.g.
Math.sin, are provided via V8.
By default, scripts are saved with the graph you are editing. (File > Save) You can instead make a script global by right-clicking it in the script list and unchecking Stored with graph. You can also quickly enter scripts that will not be saved by
- opening the JavaScript console with
Tab(quit withEsc) or - right-clicking the graph view and selecting
Execute on selection....
The Data subwindow allows you to inspect all global JavaScript variables and objects. Create them by assigning bare variables in scripts, e.g. a=5; (as opposed to var a=5;, or in the console.
The Node Appearance subwindow contains a 3x3 matrix of input boxes which can be used to display the current values of vertex attributes next to the vertex in the graph view. For instance, if the previously-mentioned script N.v=3; was run on all nodes and v is entered into the second input box in the top line of the window, then a 3 will be rendered above every node. By right-clicking a field in the Node Appearance window, you can also adjust its display colour.
graphic depictions is made available under the terms of the GNU General Public License, Version 3. Parts of the program are also covered by different licenses; see the LICENSE file for details.
On Linux, you will require the development headers for:
- V8 (
libv8-dev>=3.14.5 or thereabouts, 4.x onwards will probably not work) - freetype2 (
libfreetype6-dev) - OpenGL (
libgl1-mesa-devandlibglu1-mesa-dev)
If you have these and a sufficiently recent version of G++ installed, simply running the included Makefile should work.
For Windows builds, I strongly recommend compiling with MinGW-w64 (g++-mingw-w64-x86-64 and its dependencies on Debianesque systems). If you are happy with reusing the included binary DLLs, this may be as simple as running make -f Makefile.win64 in the program root. You can procure binaries and build scripts for the fairly standard dependencies such as zlib and freetype from Fedora's repositories, but compiling libv8.dll is a bit of an adventure and would probably require more than the length of this document to explain. I am grateful that its license frees me from the obligation to do so, but may expand upon this section later.
I expect the only significant obstacle to compiling from MSVC++ to be V8, too; while the 3.x libv8 sources include some provisions for a Microsoft build environment, they seem to be based on several assumptions about standard compliancy and state of the platform headers that no longer hold true for more recent versions.
- Drawing lots of node labels can be slow on some platforms. Generally, the "separate texture for each glyph" approach my font implementation (
fonts.cpp) uses seems to be much slower than imgui's font atlas + texture coordinates one; I will eventually switch over to it. - In the Windows binary build, TikZ export fails to correctly compute node label colours. This is a complete and utter mystery to me at the moment.
- Make graphs first-class objects, and allow a session/file to contain multiple graphs. (This should come with functions to extract induced subgraphs, merge graphs, find embeddings etc.)
- Introduce bindings for a linear algebra library such as Armadillo to enable spectral graph theory work.
- Multiple viewports
- Quality-of-life improvements:
- highlight selected edges
- camera position clamping and wrapping
- better grid snapping
- Fixed a number of memory leaks.
- Added Restricted Boltzmann Machine example.
- Nodes and edges can now store arbitrary JavaScript data.
- Likewise, all global variables created by JS get stored with the graph.
- Global variables can now be inspected in the user interface.
- Adding a javascript console, accessible with
Tab. - Adding builtin functions
printandprintln. - Bump file format version.
- Added support for manipulating the colour of nodes (N.setColour(float,float,float)) from scripts.
- Made X11 keyboard support more portable.
- Added basic support for edge data. At the moment, the "edge look" is hardcoded to display the field named "label" only.
- Switched the node label font to a more legible one, and replaced shadows with outlines.
- Fixed "Execute on selected..." doing nothing.
- Added rudimentary editor for JS node properties in context menu.
- Bump file format version.
- Initial release.