The web-based Ray dashboard can be accessed via NERSC JupyterHub in order to monitor and debug any Ray application. The latest version of Ray (2.3.0) includes a "Metrics View" which enables users to visualise Ray time series metrics. This guide walks through how to connect to the Ray dashboard via JupyterHub. Also included is how to deploy the Prometheus + Grafana services on Perlmutter via shifter which are required for Ray metrics.
 |
|---|
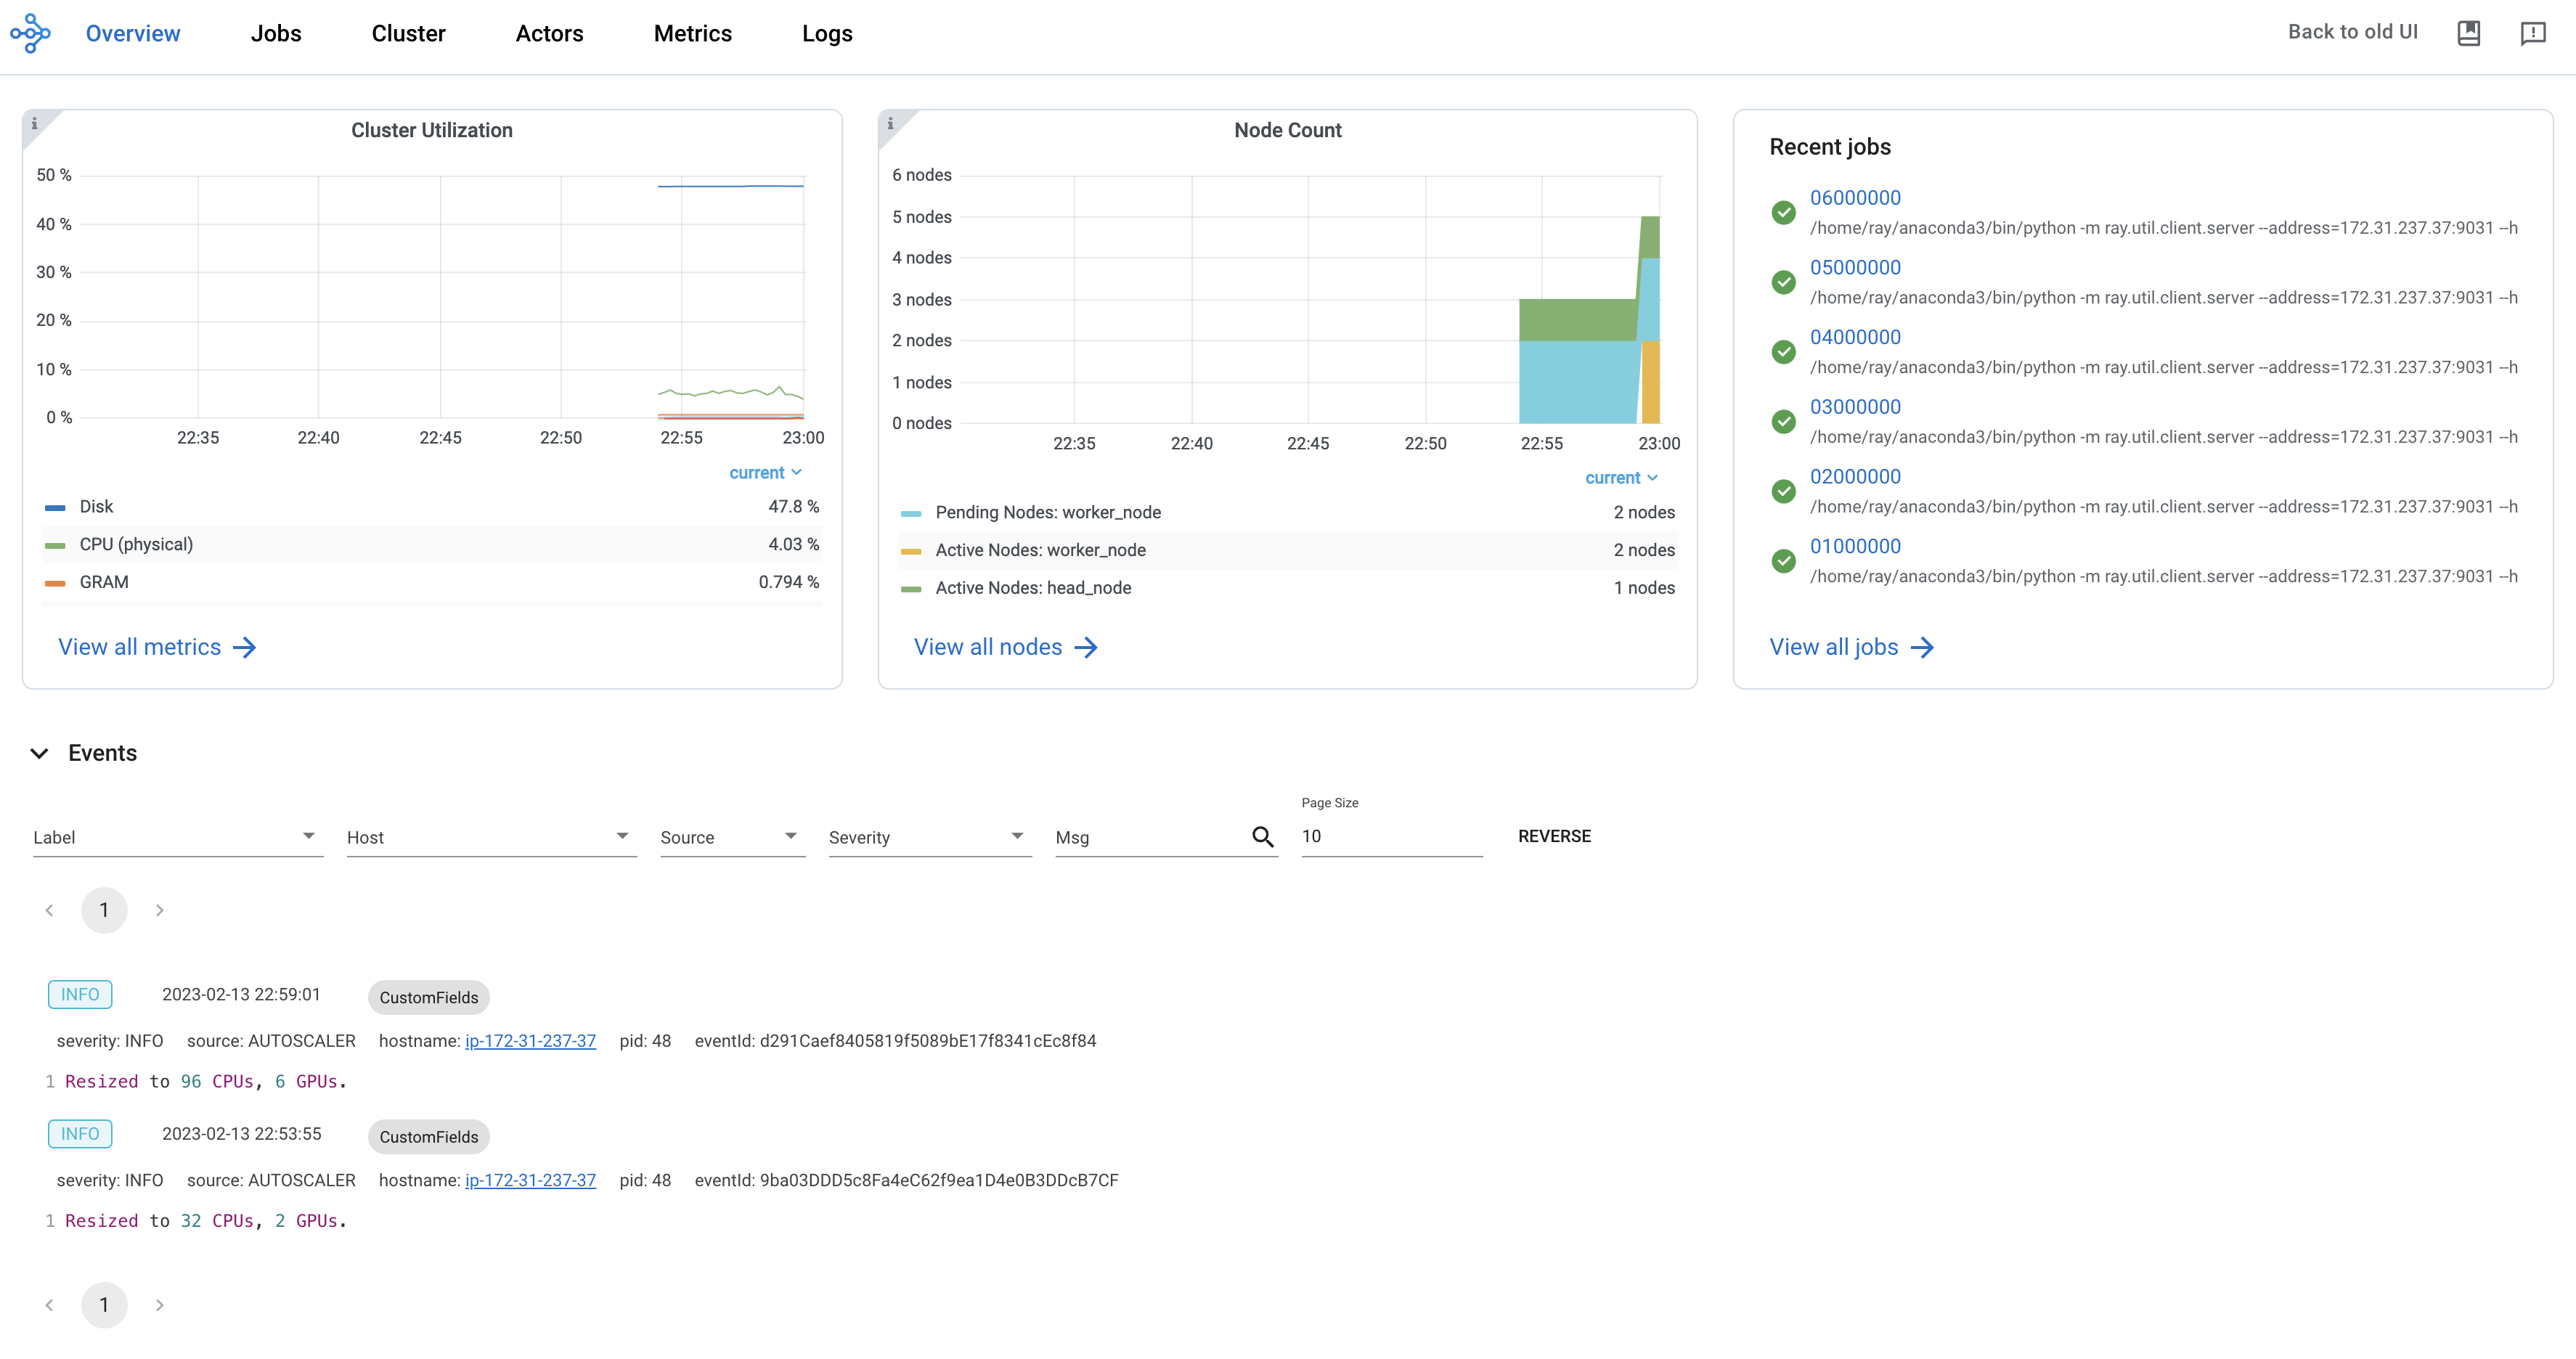
| Screenshot of the latest Ray Dashboard. Figure from Ray Docs. |
import sys
!{sys.executable} -m pip install "ray[default]>=2.3.0"
import logging
import os
import ray
from utils import get_grafana_url, start_prometheus, start_grafana, get_ray_dashboard, get_grafana_dashboardStart the Ray head node:
Warning If you want to use metrics in your Ray dashboard the Ray head node needs to know about the Grafana Host url (
RAY_GRAFANA_IFRAME_HOST).
os.environ["RAY_GRAFANA_IFRAME_HOST"] = get_grafana_url()

if ray.is_initialized:
    ray.shutdown()
ray.init(logging_level=logging.ERROR)
Note If your ray head node is not running on the same machine as this Jupyter notebook then forward the Ray dashboard port (
8265) to this machine (example:ssh -N -L localhost:8265:localhost:8265 nid02010). Port forward can be easily done with the subprocess Python library.
Once the Ray head node is running then start the prometheus service:
prometheus = start_prometheus()The start_prometheus function starts prometheus in a shifter container with the relevant configration file generated by the Ray head process.
shifter \
--image={prometheus_image} \
--volume={prometheus_db_dir}:/prometheus \
/bin/prometheus \
--config.file=/tmp/ray/session_latest/metrics/prometheus/prometheus.yml \
--storage.tsdb.path=/prometheus
Once the prometheus service is running then start the grafana service:
grafana = start_grafana()The start_grafana function starts grafana in a shifter container with the relevant configration file generated by the Ray head process.
shifter
--image={grafana_image} \
--volume={grafana_db_dir}:/grafana \
--env GF_PATHS_DATA=/grafana \
--env GF_PATHS_PLUGINS=/grafana/plugins \
--env GF_SERVER_ROOT_URL={grafana_root_url}/ \
--env GF_PATHS_CONFIG=/tmp/ray/session_latest/metrics/grafana/grafana.ini \
--env GF_PATHS_PROVISIONING=/tmp/ray/session_latest/metrics/grafana/provisioning \
--entrypointget_ray_dashboard()'https://jupyter.nersc.gov/user/elivs/perlmutter-shared-node-cpu/proxy/localhost:8265/#/new/overview'
username: admin
password: admin
get_grafana_dashboard()'https://jupyter.nersc.gov/user/elivs/perlmutter-shared-node-cpu/proxy/3000/d/rayDefaultDashboard'
ray.shutdown()
prometheus.kill()
grafana.kill()
See notebook for interactive version.