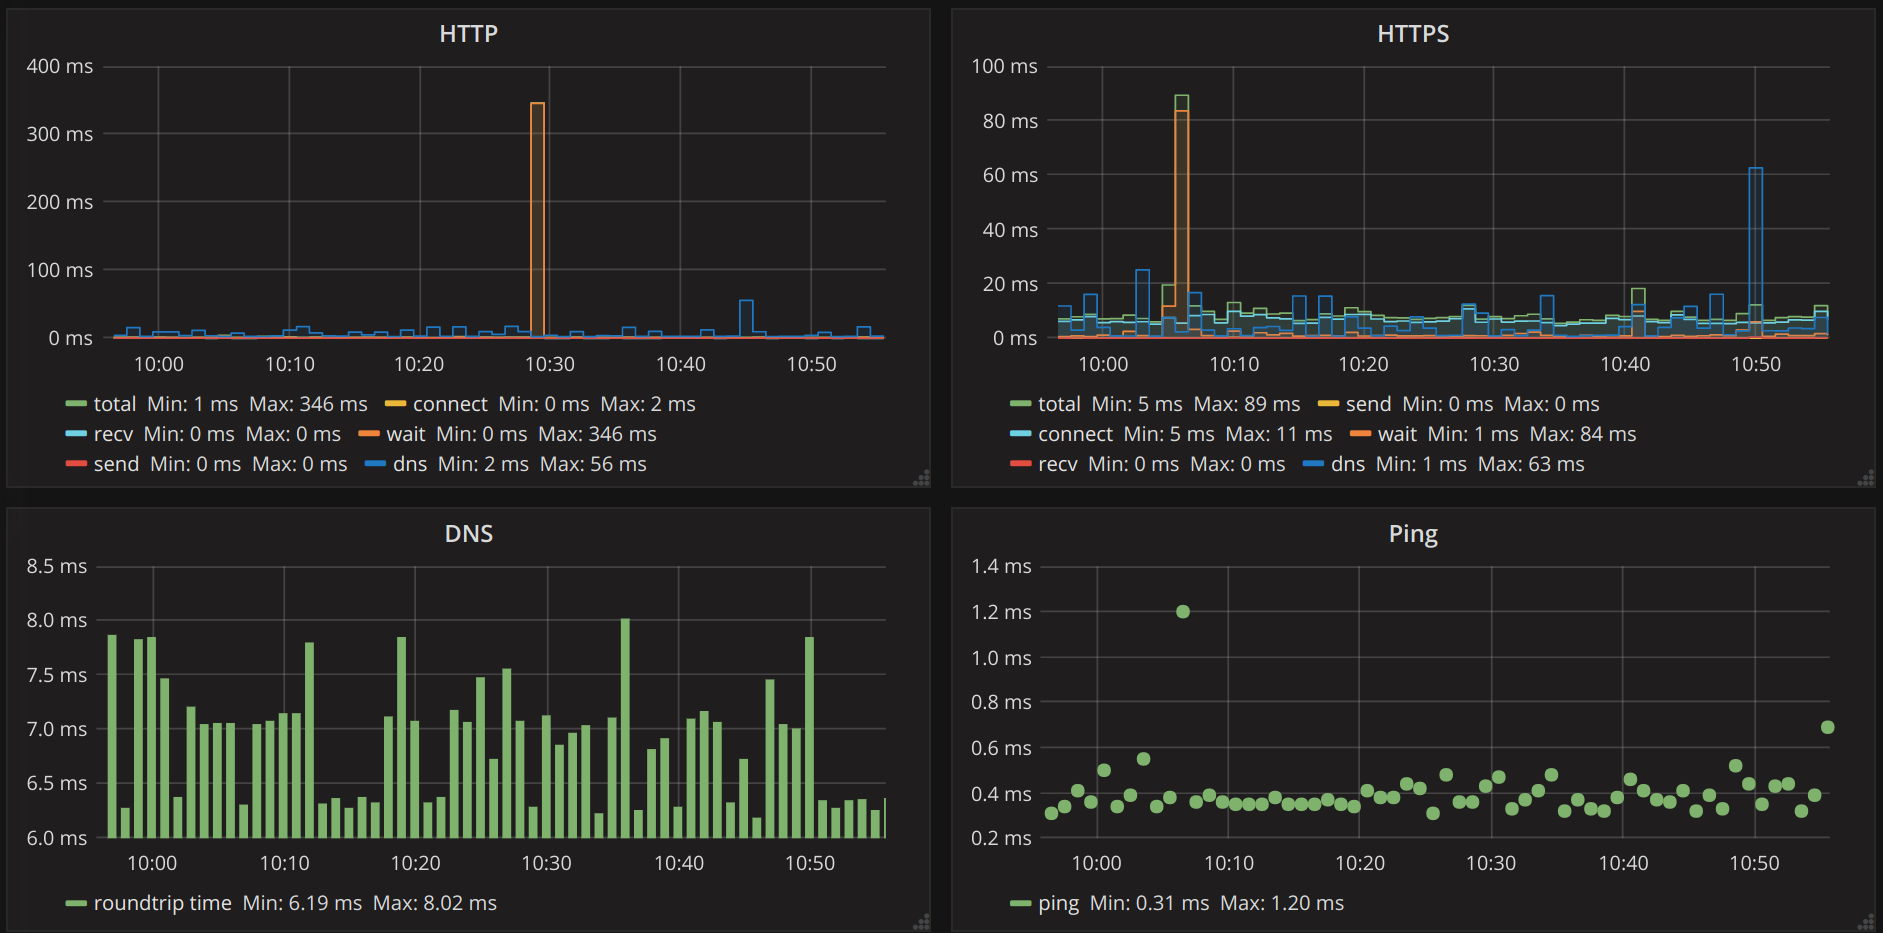
This is a datasource plugin for Grafana that can be used to visualize data from the Akumuli time-series database.
Supported features of the datasource:
- Native downsampling using one of the supported functions (avg, min, max, etc).
- Query data in the original form (without downsampling).
- Rate calculation for counters.
- Top-N query support.
- Autocomplete for metric names, tag names and values for easier discovery.
- Aliases for series names (with autocomplete).
- Templating.
- Alarms.
- Native per-series time shift.
- Group/Pivot series by tag.
Other Akumuli functions and aggregations will be added in the future.
To install the plugin simply clone this repository to your Grafana's plugins directory. It's located at {grafana}/data/plugins.
You can set the metric name and tags using the Metrics tab. Note that the query can return many time-series. If you wouldn't provide the tags, Akumuli will return all time-series that start with this metric name. To choose a subset of series from the metric one can use Tags control. You can provide more than one value for each tag. Values should be space separated. Autocomplete works for metric names, tag names, and tag values.
When the query returns many series it can be overwhelming. It makes sense to limit number of displayer series. Top-N allows you to specify max number series that should be returned. All series will be ordered by the area under the graph and the top N of them will be returned. Leave this control empty to return all series.
You can use Pivot By Tag and Group By Tag controls to merge multiple time-series together. Note that when you're use this controls the name of the series changes and this may affect how Alias is generated.
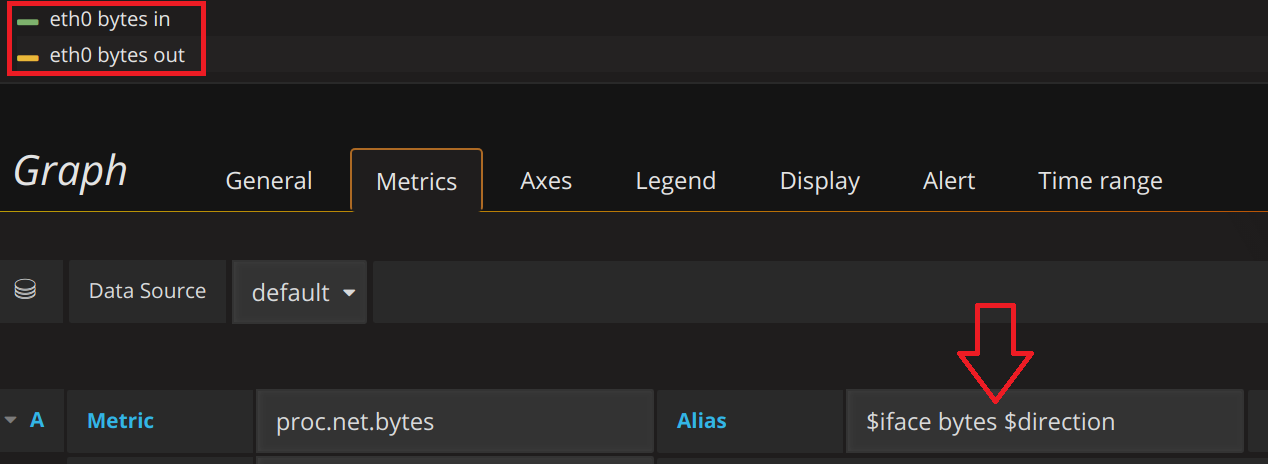
The Alias textbox can be used to provide alternative representation for the series name. You can use some plain text or you can use a template. The template can contain tag names prefixed with the '$' symbol. This names will be replaced with the tag values. For instance, if the series name is proc.net.bytes direction=in host=dev iface=eth0 and the template is $iface bytes $direction the series name will be transformed into eth0 bytes in.

You can change the downsampling interval using the Downsample control. If you'll leave it empty, Grafana will choose a meaningful default value. You can choose the aggregation function using the Func control. The values will be downsampled using the specified value. The downsampling can be disabled using the Raw checkbox. Please be careful with this option since it may slow down your dashboard or overwhelm it with data.
This option can be enabled if the time-series that you need to display is a counter. The counter value is always growing and the absolute value can be very large. The Rate function will compute the first derivative of this series. For instance, this function can be used to display the graph for the total number of network packets sent/received through the network interface.
This option can be used to shift query interval back in time. It's similar to Grafana's native 'Add time shfit' function that can be found on 'Time range' tab. The main difference is that 'Time Shift' can be set per-query. This means that you can compare different time intervals on the same plot.
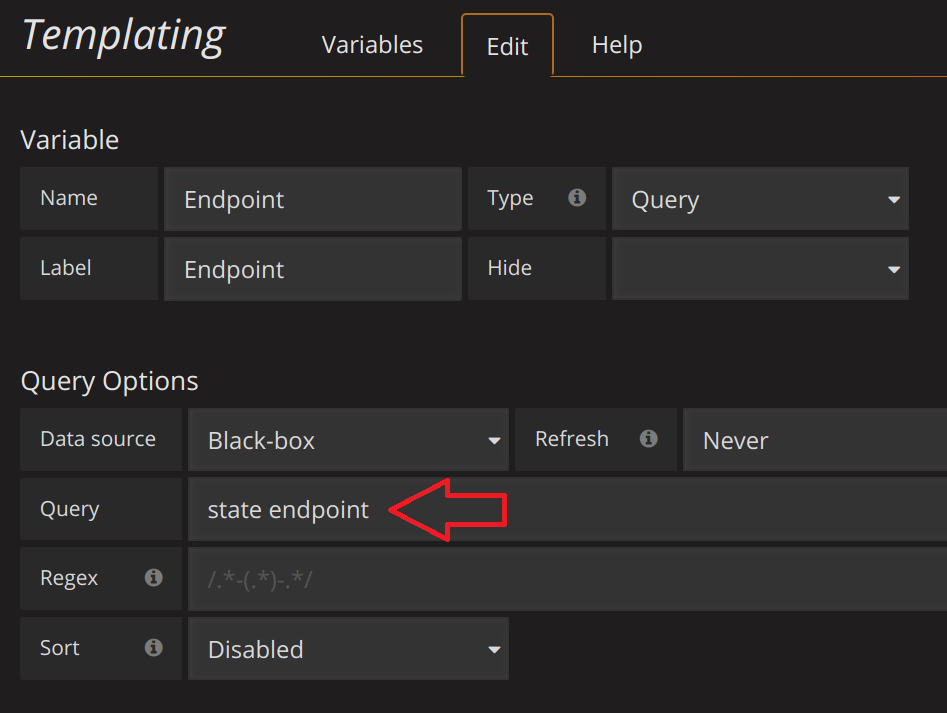
The datasource supports templating feature. Supported variable types are "Query" and "Interval". The query format is the following: <metric-name> <tag-name>. For instance, if you want to fetch the list of hosts from the database and you have the metric name called state and the host names are encoded using the endpoint tag, you can careate the variable with name "Endpoint" and query string state endpoint. After that you can create a dashboard and use the name $Endpoint as endpoint tag value instead of the actual address. The "Interval" template variable can be used with Downsample control.
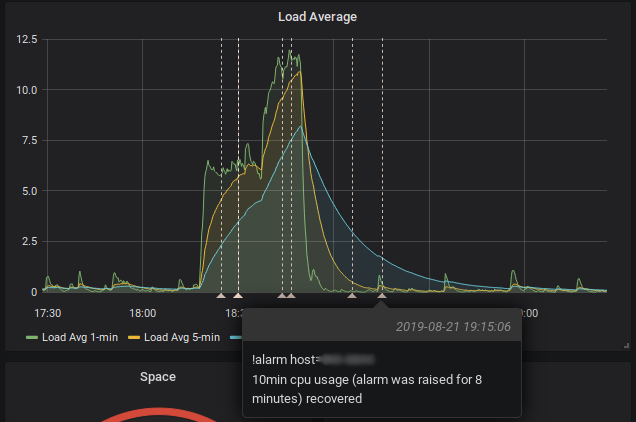
Akumuli datasource supports annotations. It is possible to use template variables in annotations editor. This fature requires Akumuli v0.8.70 or higher.
The repository already contains /dist directory with build artefacts so you don't need to build it. If you've made any changes to the source code you can re build it using the following commands:
- yarn install
- npm run build
This will fetch depnedencies and run the build script.
This plugin is based on OpenTSDB datasource plugin.


