Monitoring information for your tmux status line.
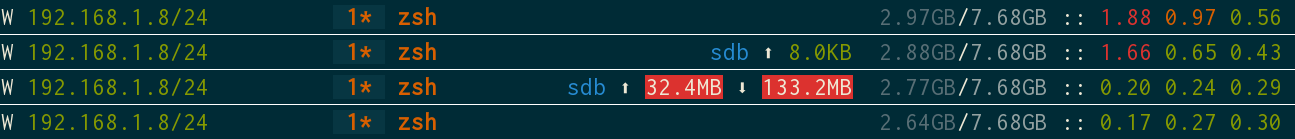
tmux-top allows you to see:
- load
- memory usage
- network statistics
- I/O statistics
- temperature

This tool is written in Go. You have to compile it yourself -- there are no binaries being provided.
This is how you can setup your Go environment.
- linux
$ go get github.com/TomasTomecek/tmux-top/cmd/tmux-top
When the command succeeds, tmux-top binary is placed in directory ${GOPATH}/bin.
$ git clone https://github.com/TomasTomecek/tmux-top.git
Let's install dependencies now:
$ go get github.com/urfave/cli
We can compile and install now:
$ make
$ sudo make install
tmux-top load— load of your workstationtmux-top mem— actual memry usage and total memorytmux-top net— network statistics: IP address, network interface and current bandwidthtmux-top io— I/O statistics: current reads and writestmux-top sensors— show sensor stats (temperature)
This json contains default configuration. If you want to change something, just override the json and store it in ~/.tmux-top. You can change whatever you want. If the value is not found in your configuration file, it's loaded from default one.
Your configuration may look like this:
{
  "net": {
    "interfaces": {
      "enp0s25": {
        "alias": "E",
        "label_color_fg": "white",
        "label_color_bg": "default",
        "address_color_fg": "colour4",
        "address_color_bg": "default"
      },
      "enp5s0": {
        "alias": "E",
        "label_color_fg": "white",
        "label_color_bg": "default",
        "address_color_fg": "colour4",
        "address_color_bg": "default"
      },
      "wlp3s0": {
        "alias": "W",
        "label_color_fg": "white",
        "label_color_bg": "default",
        "address_color_fg": "green",
        "address_color_bg": "default"
      },
      "tun0": {
        "alias": "V",
        "label_color_fg": "white",
        "label_color_bg": "default",
        "address_color_fg": "colour3",
        "address_color_bg": "default"
      }
    }
  },
  "sensors": {
    "template": "{{range $i, $device := .Devices}}{{if eq $device.Name \"coretemp\"}}{{range $j, $e := .Stats}}{{if gt .CurrentTemp 50.0}}{{tmux_display \"default\" \"colour1\" $e.CurrentTemp}}{{else if gt $e.CurrentTemp 60.0}}{{tmux_display \"default\" \"colour14\" $e.CurrentTemp}}{{end}} {{end}}{{end}}{{end}}"
  }
}
and tmux configuration:
$ tmux set -g status-left "#(tmux-top n)"
$ tmux set -g status-right "#(tmux-top m) #[fg=white]:: #(tmux-top l)"
Layout inspiration is coming from this blog post.
With sensors command, I am trying to pursue a new design of tmux-top,
utilizing Go templates. The idea is
that tmux-top will just gather the data and offer it to you as Go structs
which you can easily utilize and display by writing a Go template. There will
be a sensible default.
You can easily print what data is available to you:
$ tmux-top sensors --format '{{.|printf "%#v"}}'
sens.SensorsStats{Devices:[]sens.DeviceStat{sens.DeviceStat{Name:"acpitz", LowValue:48, HighValue:48, Stats:[]sens.TemperatureStat{sens.TemperatureStat{Label:"", CurrentTemp:48}}}, sens.DeviceStat{Name:"", LowValue:1e+06, HighValue:-100, Stats:[]sens.TemperatureStat{}}, sens.DeviceStat{Name:"pch_wildcat_point", LowValue:48.5, HighValue:48.5, Stats:[]sens.TemperatureStat{sens.TemperatureStat{Label:"", CurrentTemp:48.5}}}, sens.DeviceStat{Name:"iwlwifi", LowValue:41, HighValue:41, Stats:[]sens.TemperatureStat{sens.TemperatureStat{Label:"", CurrentTemp:41}}}, sens.DeviceStat{Name:"coretemp", LowValue:52, HighValue:55, Stats:[]sens.TemperatureStat{sens.TemperatureStat{Label:"Package id 0", CurrentTemp:55}, sens.TemperatureStat{Label:"Core 0", CurrentTemp:52}, sens.TemperatureStat{Label:"Core 1", CurrentTemp:55}}}}}
We can see, there is a struct SensorsStats and it contains array of structs
DeviceStat. Let's see what sensors are available:
$ tmux-top sensors --format '{{range $i, $device := .Devices}}{{.Name}}: {{.|printf "%#v\n"}}{{end}}'
acpitz: sens.DeviceStat{Name:"acpitz", LowValue:45, HighValue:45, Stats:[]sens.TemperatureStat{sens.TemperatureStat{Label:"", CurrentTemp:45}}}
: sens.DeviceStat{Name:"", LowValue:1e+06, HighValue:-100, Stats:[]sens.TemperatureStat{}}
pch_wildcat_point: sens.DeviceStat{Name:"pch_wildcat_point", LowValue:48, HighValue:48, Stats:[]sens.TemperatureStat{sens.TemperatureStat{Label:"", CurrentTemp:48}}}
iwlwifi: sens.DeviceStat{Name:"iwlwifi", LowValue:42, HighValue:42, Stats:[]sens.TemperatureStat{sens.TemperatureStat{Label:"", CurrentTemp:42}}}
coretemp: sens.DeviceStat{Name:"coretemp", LowValue:46, HighValue:46, Stats:[]sens.TemperatureStat{sens.TemperatureStat{Label:"Package id 0", CurrentTemp:46}, sens.TemperatureStat{Label:"Core 0", CurrentTemp:46}, sens.TemperatureStat{Label:"Core 1", CurrentTemp:46}}}
Each DeviceStat has fields Name (might not be populated though, LowValue,
HighValue (so you can do conditions) and array of actual values, available as
Stats. Let's see a full example:
$ tmux-top sensors --format '{{range $i, $device := .Devices}}{{.Name}}: {{range $j, $stat := .Stats}}{{.CurrentTemp}} {{end}}{{printf "\n"}}{{end}}'
acpitz: 44
:
pch_wildcat_point: 46.5
iwlwifi: 42
coretemp: 45 45 44
The default is:
$ tmux-top sensors --format '{{range $i, $device := .Devices}}{{if eq .Name "coretemp"}}{{if gt $device.HighValue 50.0}}Temp: {{range $j, $e := $device.Stats}}{{$e.CurrentTemp}} {{end}}{{end}}{{end}}{{end}}'
Temp: 67 67 67
It prints temperature if it's higher than 50 °C and it select only sensor on CPU.
There is also one helper function available to print values in tmux syntax:
{{tmux_display "default" "colour14" .CurrentTemp}}
which would yield
#[bg=default,fg=colour14]65#[bg=default,fg=default]
all of the data is coming from /sys/class/hwmon/*.