tinyplot is a simple HTML5 canvas plotting library with a focus on mobile.
Live demo: https://rawgit.com/TinyMission/tinyplot/master/demo/index.html
You just need to include the tinyplot CSS and Javascript files in your page. They are available in development and minified versions. For the Javascript file, there are builds with and without the dependencies (lodash, jquery.mousewheel, moment, interact). If you use the -deps version, the only explicit dependency is jQuery.
tinyplot.js OR tinyplot-deps.js
tinyplot.min.js OR tinyplot-deps.min.js
In general, charts are created with the following style:
var chart = new tinyplot.<chart-type>(container, data, options)where is the type of chart you're creating (see below). container is the selector, html node, or jQuery that will contain the chart. data is an array of objects to plot. options is an object containing options for the chart.
- title: the top title of the chart
- subtitle: the subtitle (goes below the title)
- xZoom / yZoom: the type of zoom interaction for each axis. Possible values are 'none', 'user' (will zoom with pinch/scroll), and auto (will zoom automatically to fit data). The defaults depend on the chart type.
- xLabel / yLabel: the labels that go on each axis
- xMaxTicks / yMaxTick: the maximum number of ticks on each axis (default=10, use a lower value for smaller charts).
- grid: Which part of the grid to render. Possible values are 'none', 'x', 'y', and 'xy' (default).
This is meant to plot data with monotonically increasing values in the x dimension (like times).
In addition to the common options, TimeseriesChart supports an additional set of options:
- timeField: name of the field in data to be used on the x axis
- series: an array of objects with (one for each time series to plot), with the following fields:
- yField: the name of the field in data to use as the y axis
- width: the line width (default=1)
- marker: the marker to render at each point. Possible values are 'none' (default), 'circle', 'triangle', and 'square'.
- markerSize: the size - in pixels - of the marker (default=6)
Example call:
var chart = new tinyplot.TimeseriesChart('#timeseries', data, {
    timeField: 'time',
    xLabel: 'Time',
    yLabel: 'Foo / Bar',
    title: 'Timeseries',
    subtitle: 'Scroll/pinch to zoom in time, drag to pan',
    grid: 'xy',
    series: [
        {
            yField: 'foo',
            color: '#00a',
            marker: 'circle'
        },
        {
            yField: 'bar',
            color: '#0a0',
            marker: 'triangle'
        }
    ]
})
This will produce a chart similar to the following (from the live demo):
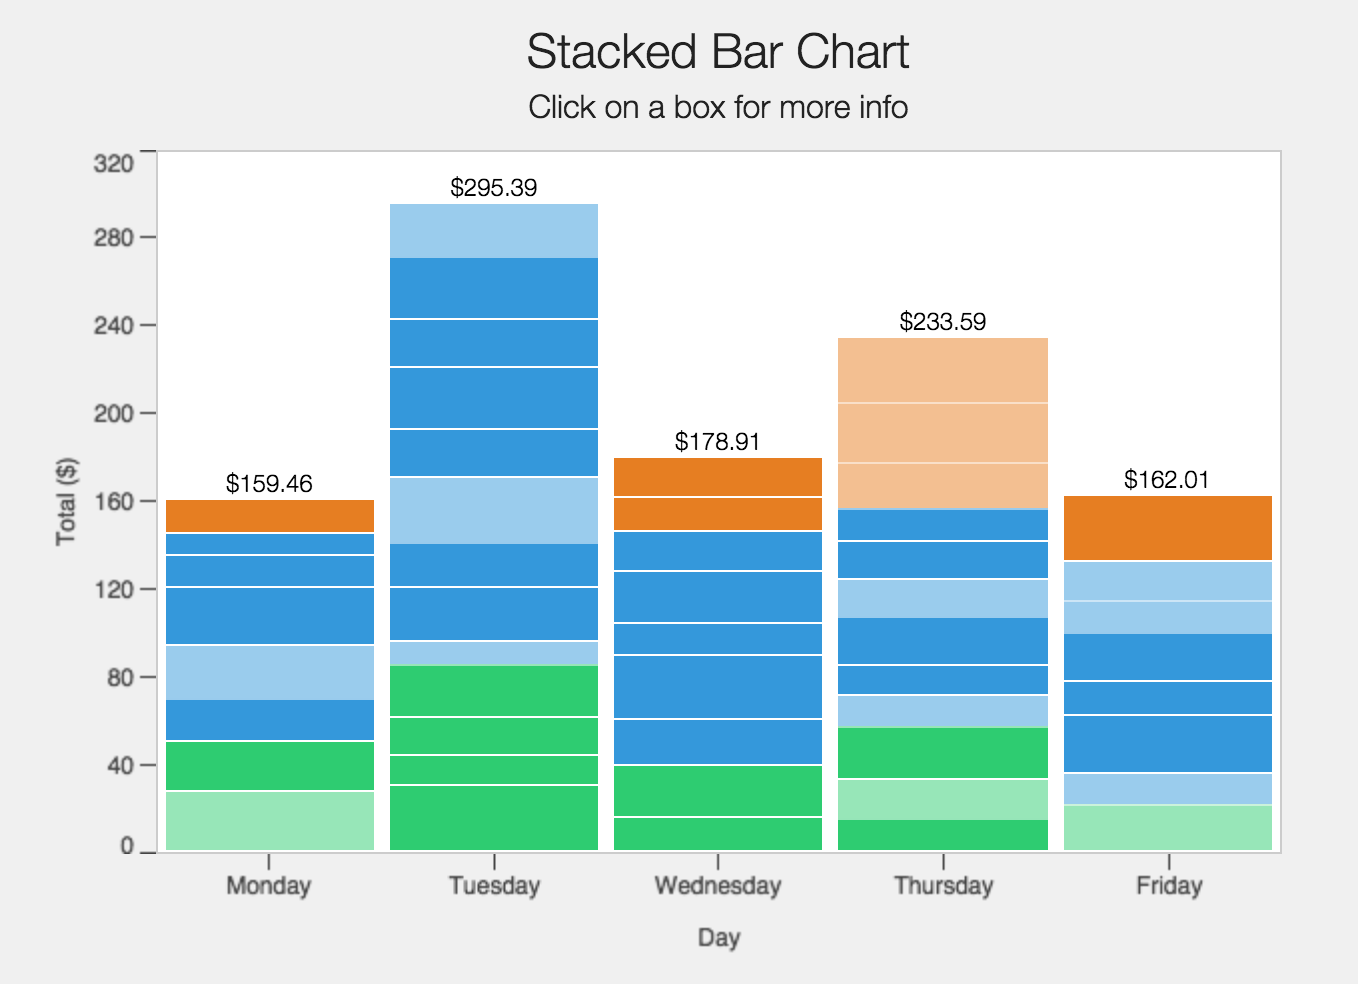
This is like a regular bar chart, except that it can display more than two dimensions by grouping/coloring by a third field (and changing opacity by a fourth field).
In addition to the common options, the stacked bar chart takes the following additional options:
- xOrder: an array containing the exact possible values and order of the x axis
- groupField: name of the field by which to group and color boxes
- groupOrder: an array containing the exact possible values and order of the grouped field
- groupColors: object mapping groupField values to CSS colors
- opacityField: name of field that contains the opacity of each box (optional)
- onClick: a function that will get called when a box is clicked (takes the data row as an input)
Example call:
var dows = ['Monday', 'Tuesday', 'Wednesday', 'Thursday', 'Friday']
var groups = ['green', 'blue', 'orange']
var chart = new tinyplot.StackedBarChart('#stacked-bar', barData, {
    xField: 'dow',
    xOrder: dows,
    yField: 'total',
    title: 'Stacked Bar Chart',
    subtitle: 'Click on a box for more info',
    opacityField: 'opacity',
    groupField: 'group',
    groupOrder: groups,
    groupColors: {
        green: '#2ecc71',
        blue: '#3498db',
        orange: '#e67e22'
    },
    xLabel: 'Day',
    yLabel: 'Total ($)',
    yPrefix: '$',
    onClick: function (item) {
        console.log("clicked on " + JSON.stringify(item))
        alert(JSON.stringify(item))
    }
})
More chart types are coming soon...
The MIT License (MIT)
Copyright (c) 2015 Andy Selvig [email protected]
Permission is hereby granted, free of charge, to any person obtaining a copy of this software and associated documentation files (the "Software"), to deal in the Software without restriction, including without limitation the rights to use, copy, modify, merge, publish, distribute, sublicense, and/or sell copies of the Software, and to permit persons to whom the Software is furnished to do so, subject to the following conditions:
The above copyright notice and this permission notice shall be included in all copies or substantial portions of the Software.
THE SOFTWARE IS PROVIDED "AS IS", WITHOUT WARRANTY OF ANY KIND, EXPRESS OR IMPLIED, INCLUDING BUT NOT LIMITED TO THE WARRANTIES OF MERCHANTABILITY, FITNESS FOR A PARTICULAR PURPOSE AND NONINFRINGEMENT. IN NO EVENT SHALL THE AUTHORS OR COPYRIGHT HOLDERS BE LIABLE FOR ANY CLAIM, DAMAGES OR OTHER LIABILITY, WHETHER IN AN ACTION OF CONTRACT, TORT OR OTHERWISE, ARISING FROM, OUT OF OR IN CONNECTION WITH THE SOFTWARE OR THE USE OR OTHER DEALINGS IN THE SOFTWARE.

