The DE4LungCancer framework is devised as a network of data ecosystems (DEs)[1]; it aligns data and metadata to describe the network and its components. Heterogeneity issues across the different datasets are overcome by various data curation and integration methods. Each DE comprises datasets and programs for accessing, managing, and analyzing their data. Interoperability issues across the datasets of the DEs are solved in a unified schema. Mapping rules between the datasets and the unified schema describe the meaning of the datasets. The metadata layer specifies biomedical vocabularies (e.g., Unified Medical Language System-UMLS or Human Phenotype Ontology-HPO). The DE4LungCancer DE is a nested framework that is also composed of three basic DEs: Clinical, Scholarly, and Scientific Open. These basic DEs are described in terms of datasets, metadata, and methods; they enable each basic DE to conduct individual analyses based on locally collected data. On the other hand, the nested DE4LungCancer DE comprises the basic DEs and integrates the data processed by each. As a result, the nested DE4LungCancer DE provides a holistic profile of a lung cancer patient composed of the data process by Clinical, Scholarly, and Scientific Open DEs; these profiles are represented in the DE4LungCancer knowledge graph (KG).

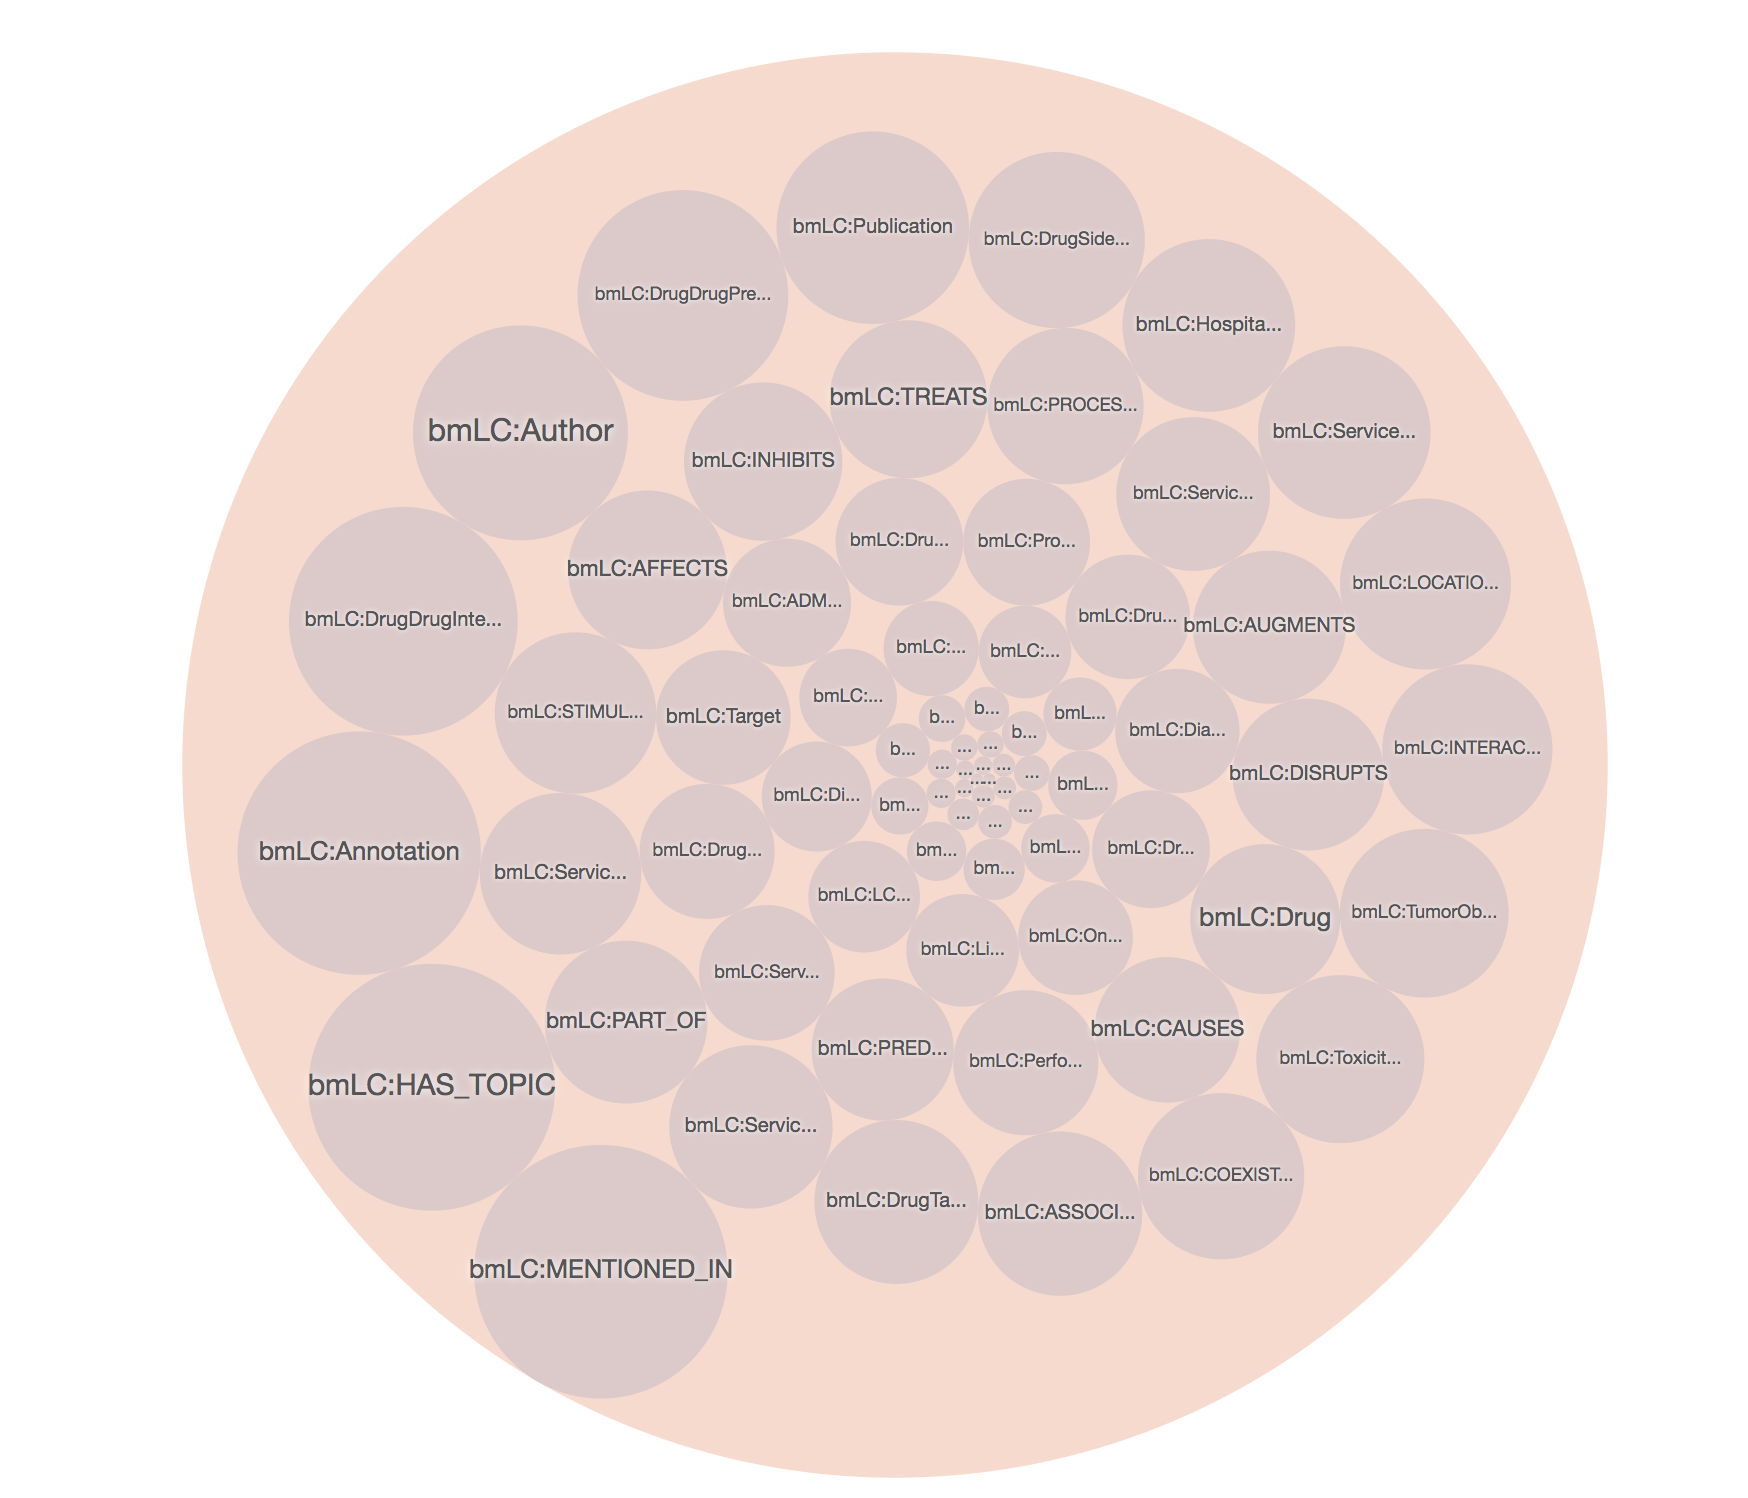
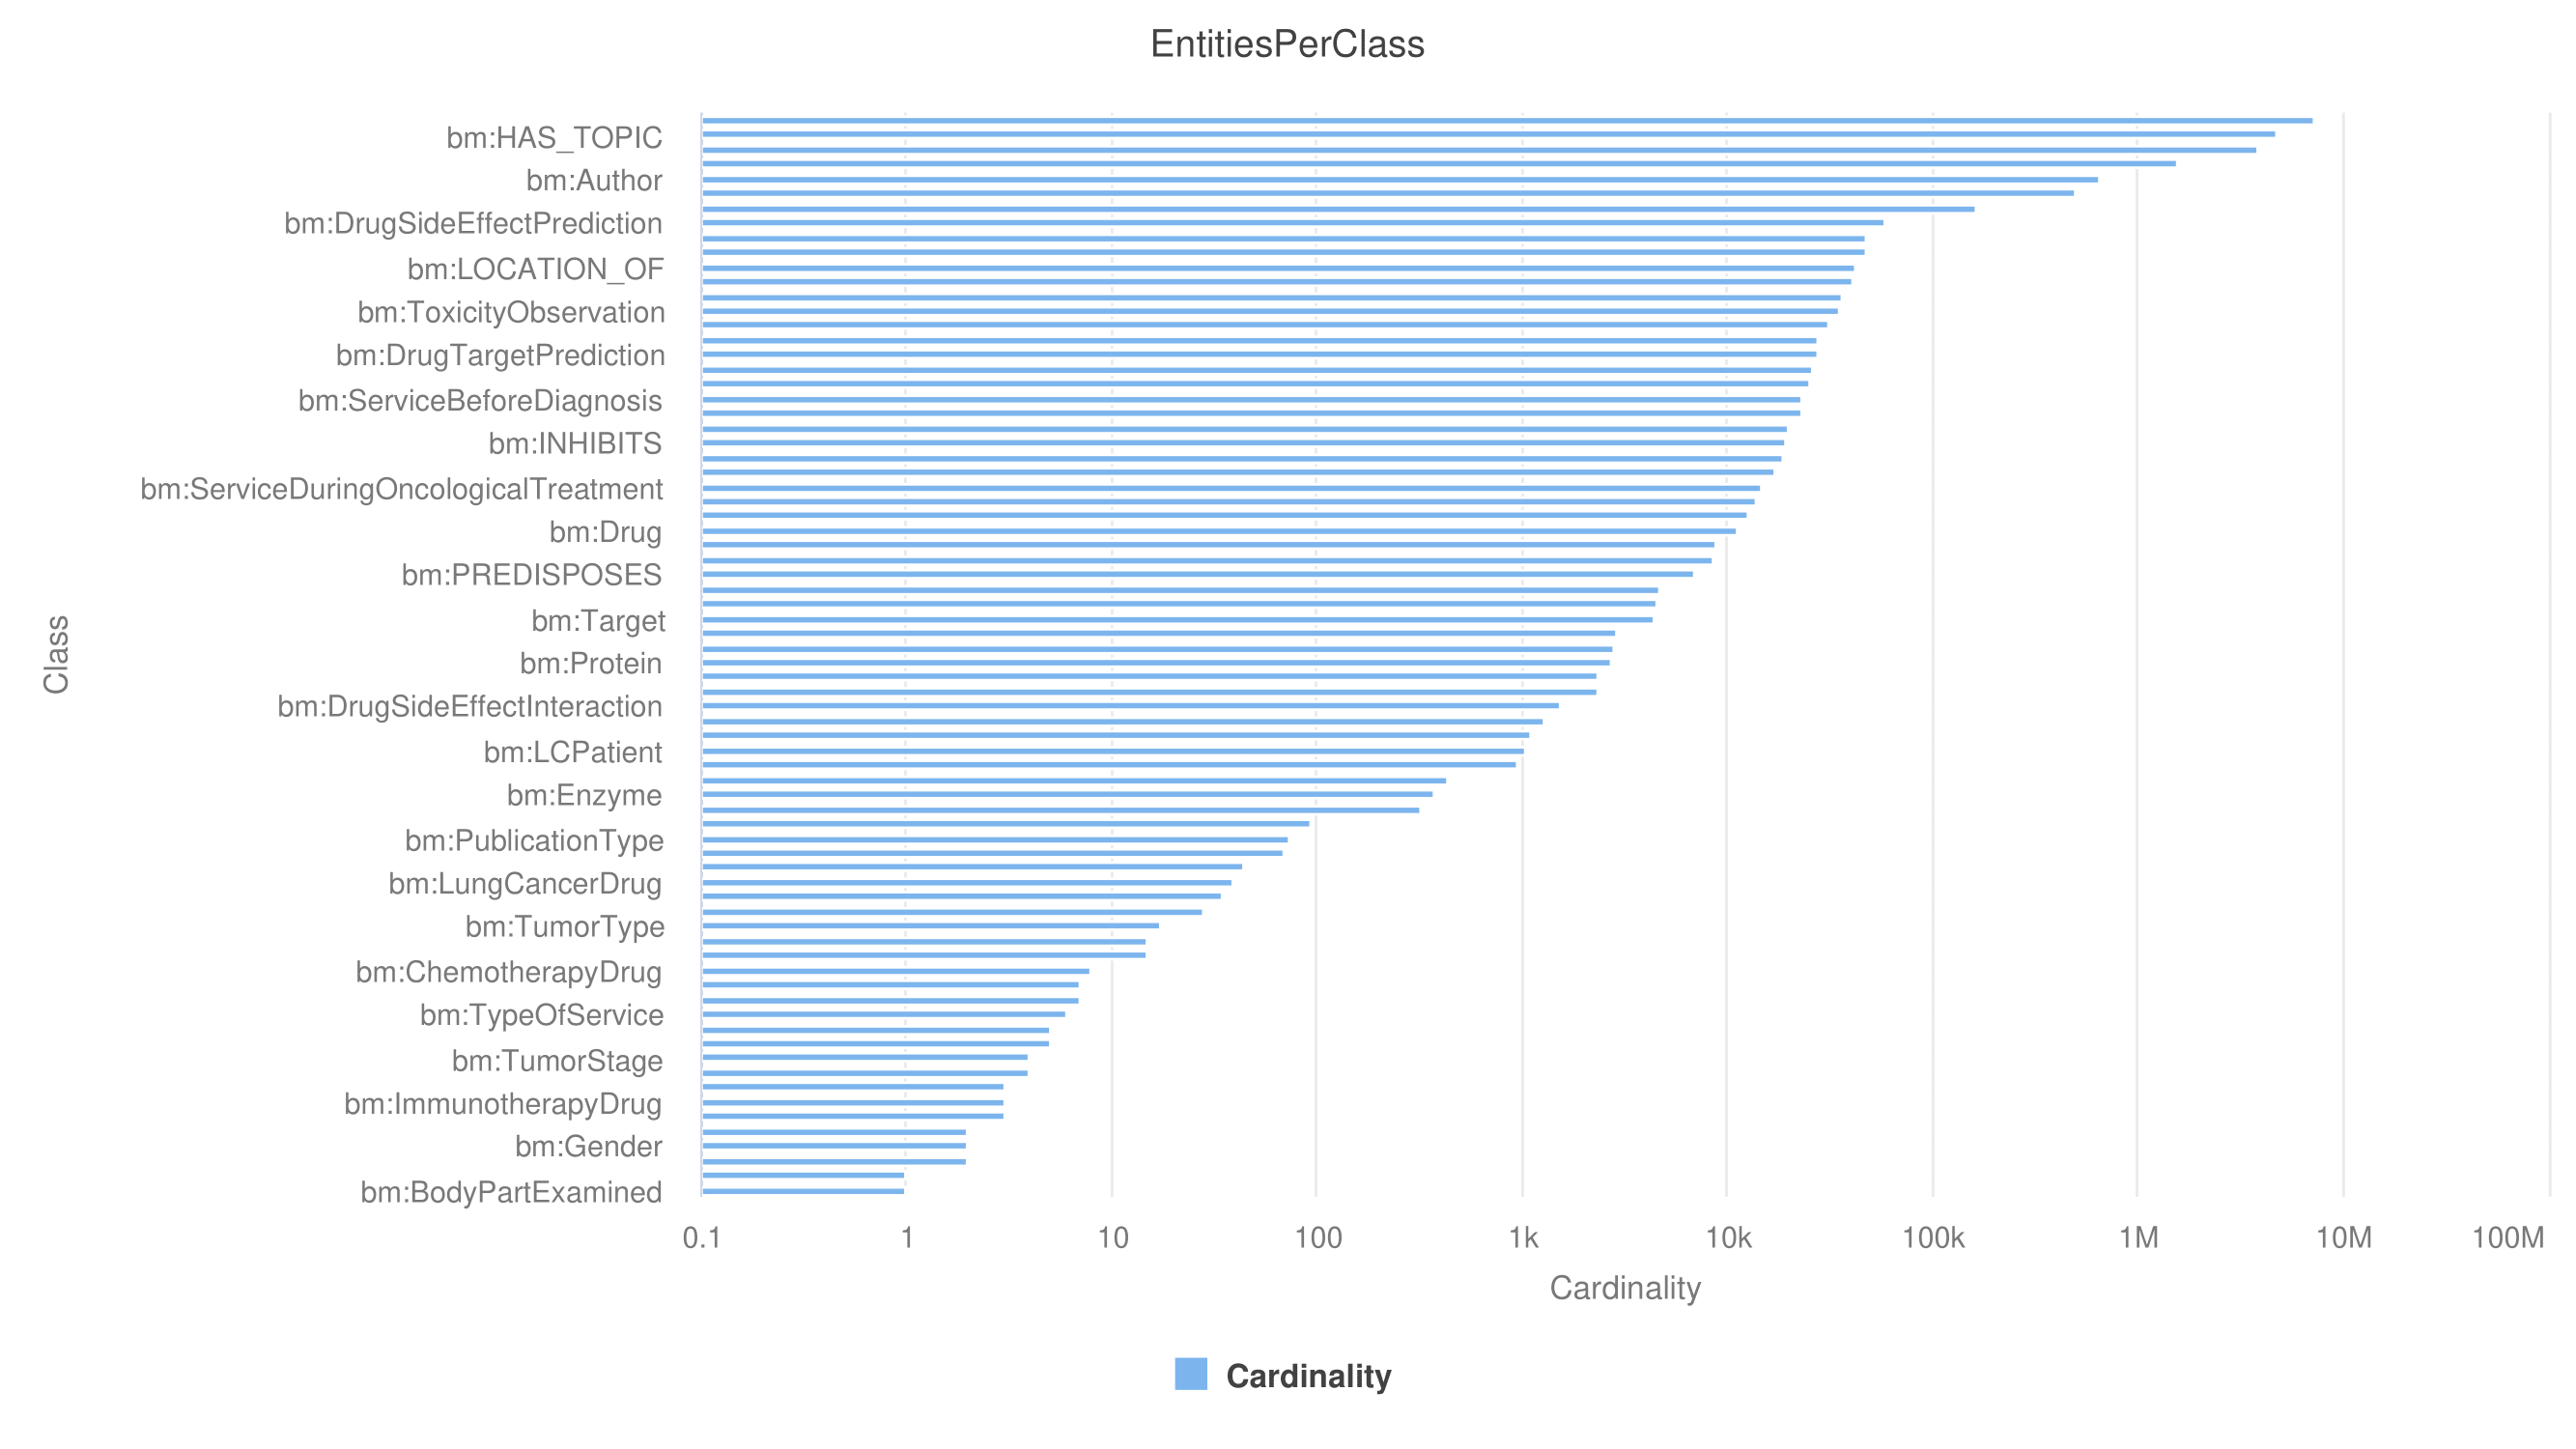
SDM-RDFizer [2], an in-house RML-compliant engine, is utilized to integrate data from the data sources into the KG following the mapping rules. As a result, a KG of 19,602,972 biomedical entities described in terms of 110,788,660 RDF triples is created. Moreover, 3,900,764 links to DBpedia, Wikidata, and UMLS are part of the KG; they are discovered by the tasks of NER and NEL executed by the FnO function included in the mapping rules and by the NLP processes implemented in each DE. The classes DE4LC:MENTION_IN, and DE4LC:HAS_TOPIC are populated with entities extracted from scientific publications, while DE4LC:Annotation comprises the UMLS terms that annotate the entities recognized by the NER implemented on top of the DE4LungCancer datasets.
The data quality methodology is composed of four steps: (a) Definition of the constraints; (b) Validation of the constraints; (c) Human validation by the domain experts; and (d) Resolution of the ambiguities. First, the metadata describing the DE4LungCancer data sources and the description of the universe of discourse represented in these data sources are analyzed to identify integrity constraints. Clinical and technical partners were consulted to collect the main constraints to be satisfied. Moreover, the concepts and relations existing in the unified schema were utilized to guide the definition of the constraints. First, constraints describing the properties of the attributes of a class in the DE4LungCancer unified schema were identified, i.e., intra-concept constraints, and next, constraints regarding the relationships existing between these concepts or inter-concept constraints are determined. Intra-concept constraints include (a) data types of the attributes, (b) attribute dependencies, (c) cardinalities, and functional dependencies. Additionally, inter-concept constraints encompass referential integrity, cardinality and connectivity, and mandatory and optional relationships among the concepts in the unified schema. Once the constraints are recognized, they are formally specified as expressions of SQL, SHACL, and SPARQL, and evaluated both over the corresponding raw data and the data integrated into the KG; the SHACL validation engine Trav-SHACL [3] was used to validate the SHACL constraints against the KG.
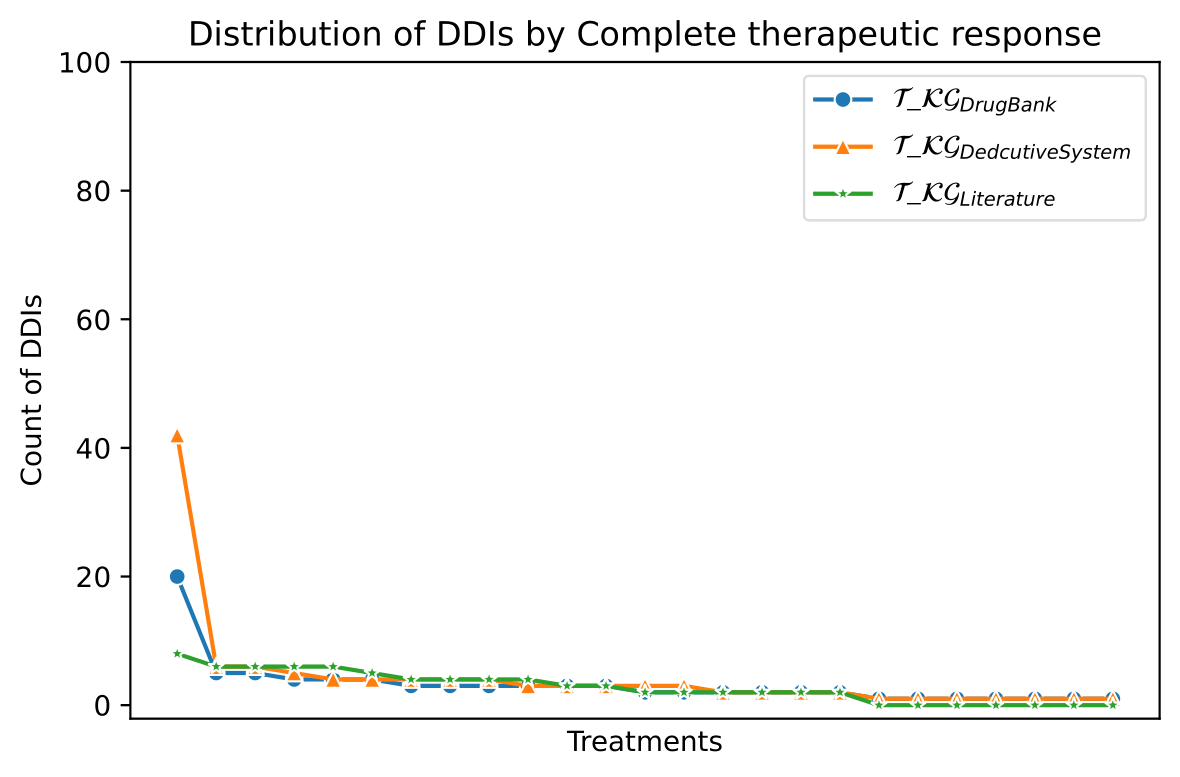
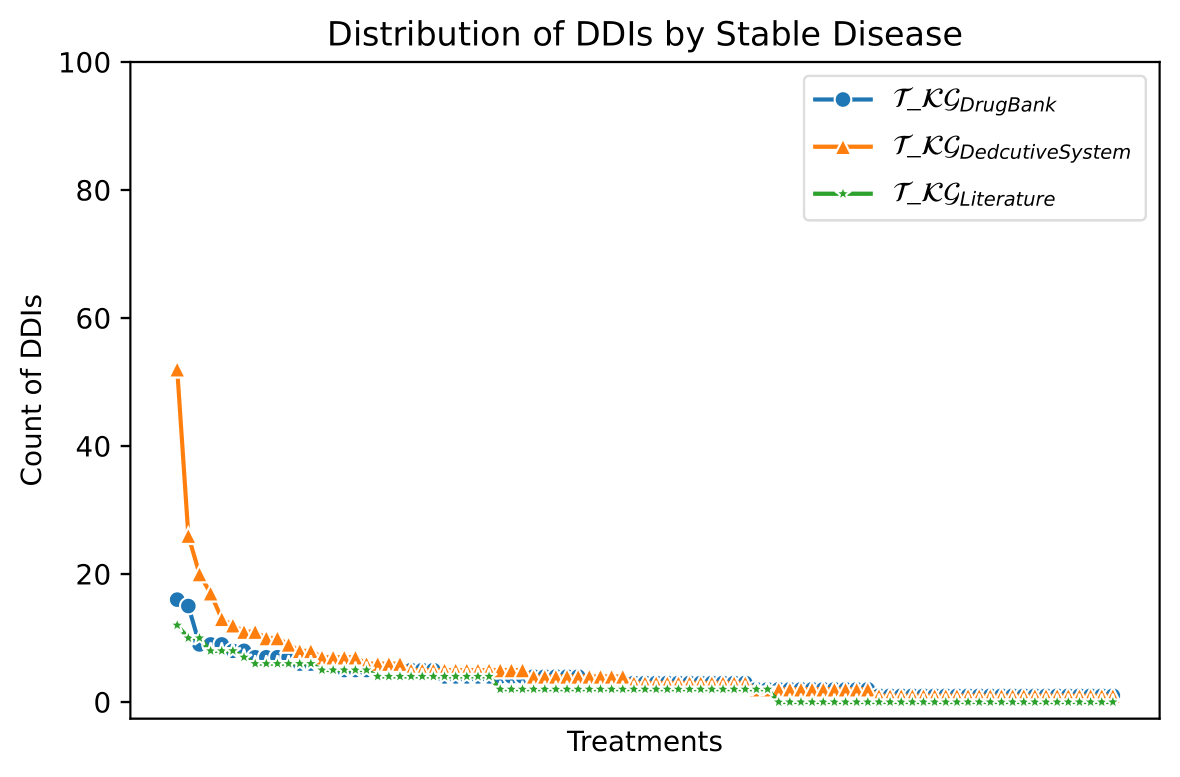
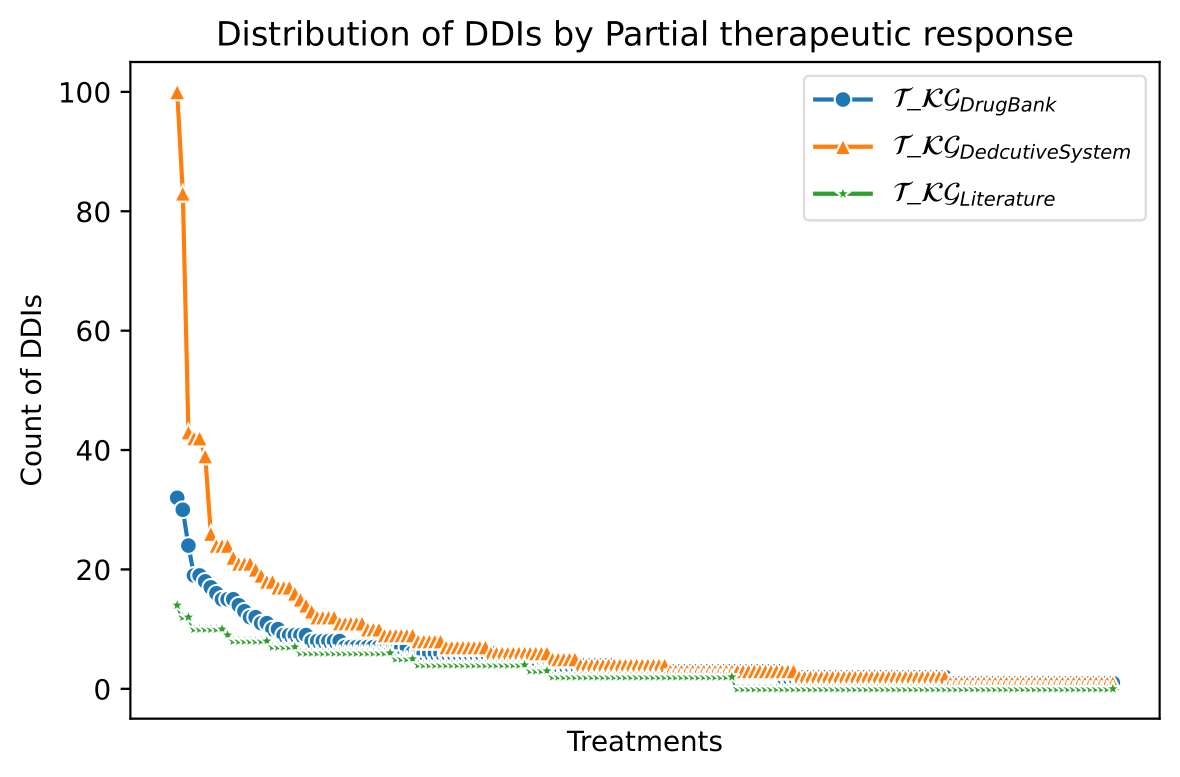
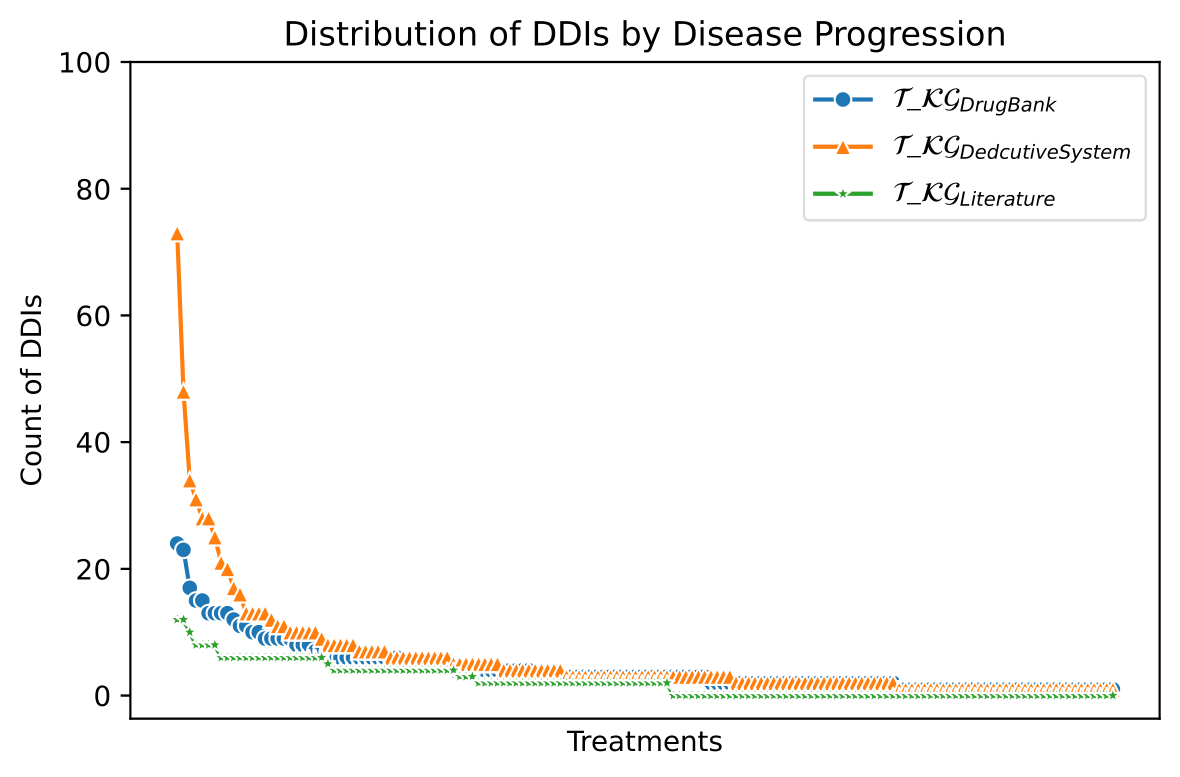
The knowledge represented in the DE4LungCancer KG is exploited to understand the impact of the interactions between a treatment's drugs on the effectiveness of the treatment. The evaluation of treatments' effectiveness is performed based on the number of toxicities observed in the lung cancer patients and the assessment of a treatment's response provided by the patients' oncologists; these results are part of the clinical records processed by the Clinical DE and integrated into the DE4LungCancer KG. The DDIs in a treatment are computed based on three computational methods. The first method (DrugBank) computes the number of DDIs in treatment based on the DDIs reported on DrugBank. We extracted the DDIs from DrugBank and included them in our DE4LungCancer KG. The second method (DS) proposed by Rivas and Vidal [4] deduces new DDIs based on a deductive system implemented in Datalog on top of KG. DS is defined in terms of Datalog rules, and it exploits the fine-grained representation of the DDIs generated by FALCON [5]. The third method (Literature) proposed by Bougiatiotis et.al. [6] predicts DDIs based on the Scholarly DE. This method analyses the paths connecting interacting and non-interacting drug pairs in this DE Knowledge Graph and trains a machine learning algorithm (Random Forest) to discriminate between those two classes. Based on the trained model, we then apply predictions to all non-interacting pairs to identify potential DDIs that were not previously known based on the resulting prediction confidence scores. We have selected the most frequent oncological treatments for analyzing their toxicities.

We have extracted from DE4LungCancer KG the lung cancer treatments with their respective responses. Our purpose is to compute the distribution of DDIs for each treatment response. The hypothesis is that treatments with a complete therapeutic response or stable disease have fewer DDIs than treatments with partial therapeutic response and disease progression. To have the treatments in four disjoint sets of treatment responses, the data were processed. For treatments with different responses, the most frequent response is selected. Thus, each treatment is classified into a single response class. The DDIs for each treatment are computed based on the DDIs reported on DrugBank, and two computational methods.
An initial version of the aforementioned dashboard [7] has been provided to a group of relevant stakeholders to assess its quality and characteristics. Specifically, 44 evaluators have participated in dedicated training and evaluation sessions, running different scenarios, testing the dashboard functionalities, and querying to retrieve data and information of interest. They were then given a questionnaire, asking them to input general profile information and their motivation for utilizing the dashboard The evaluators justified the use of the system and data based on the following reasons:
- to analyze the characteristics of special populations for queries related to survival curve analysis;
- to learn how to use the platform and the various functionalities as a knowledge tool about lung cancer; and
- to identify some interesting publications and drug interactions

Finally, the evaluators were asked to rate their overall experience with the dashboard and report any issues found or propose features that they considered missing. The results indicated a positive acceptance by most stakeholders, indicating some features and improvements that could be done for the dashboard to be easily employed in different regions and by various end-users.

References
[1] S. Geisler, M. Vidal, C. Cappiello, B. F. Lóscio, A. Gal, M. Jarke, M. Lenzerini, P. Missier, B. Otto, E. Paja, B. Pernici, and J. Rehof. Knowledge-driven data ecosystems toward data transparency. ACM J. Data Inf. Qual., 14(1):3:1–3:12, 2022.
[2] E. Iglesias, S. Jozashoori, D. Chaves-Fraga, D. Collarana, and M.-E. Vidal. Sdm-rdfizer: An rml interpreter for the efficient creation of rdf knowledge graphs. In ACM International Conference on Information & Knowledge Management, 2020.
[3] M. Figuera, P. D. Rohde, and M. Vidal. Trav-shacl: Efficiently validating networks of SHACL constraints. In WWW ’21: The Web Conference 2021, Virtual Event / Ljubljana, Slovenia, April 19-23, 2021, pages 3337–3348, 2021.
[4] A. Rivas and M.-E. Vidal. Capturing knowledge about drug-drug interactions to enhance treatment effectiveness. In Proceedings of the 11th on Knowledge Capture Conference, K-CAP ’21, page 33–40, New York, NY, USA, 2021. Association for Computing Machinery.
[5] A. Sakor, K. Singh, A. Patel, and M. Vidal. Falcon 2.0: An entity and relation linking tool over wikidata. In The 29th ACM International Conference on Information and Knowledge Management- CIKM, 2020.
[6] K. Bougiatiotis, F. Aisopos, A. Nentidis, A. Krithara, and G. Paliouras. Drug-drug interaction prediction on a biomedical literature knowledge graph. In International Conference on Artificial Intelligence in Medicine, pages 122–132. Springer, 2020.
[7] A. Krithara, F. Aisopos, V. Rentoumi, A. Nentidis, K. Bougatiotis, M.-E. Vidal, E. Menasalvas, A. Rodriguez-Gonzalez, E. Samaras, P. Garrard, et al. iasis: Towards heterogeneous big data analysis for personalized medicine. In 2019 IEEE 32nd International Symposium on Computer-Based Medical Systems (CBMS), pages 106–111. IEEE, 2019.
Fotis Aisopos, Samaneh Jozashoori, Emetis Niazmand, Disha Purohit, Ariam Rivas, Ahmad Sakor, Enrique Iglesias, Dimitrios Vogiatzis, Ernestina Menasalvas, Alejandro Rodriguez Gonzalez, Guillermo Vigueras, Daniel Gomez-Bravo, Maria Torrente, Roberto Hernández López, Mariano Provencio Pulla, Athanasios Dalianis, Anna Triantafillou, Georgios Paliouras and Maria-Esther Vidal