Credit to JohnDoesStuff on Youtube for making the Cartesian coordinates functions.
I do not know nearly enough of trigonometry to make that.
https://www.youtube.com/channel/UCUTey_NRgvUNBUvtY0KY4Ew
Executes JS on a Desmos embed to generate expressions in 3D space from Wavefront data
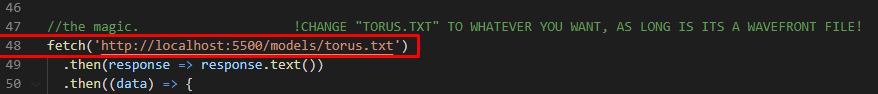
Use something like a VS Code Live Server to run it. If you don't want to use VS Code then make sure you change the port in line 48 to what port you are hosting on.
Line 48 allows you to change the model being used.
If you want to add your own models they must be in text form and in the models folder.
I do not suggest putting in any models that are over ~800 faces as I've observed them to be unusably laggy and sometimes break the script.
If you want to save the graph, this isn't easily possible because you cannot save graphs in the embedded version of Desmos.
Navigate to your browser's developer console and paste in the following:
state = Calc.getState();
outText = "";

for (let item of state.expressions.list) {
  if (typeof(item["type"] !== "undefined")) {
    if (item.type === "expression") outText += item.latex + "\n";
  }
}

copy(outText);
This will save all of the expressions in the graph to your clipboard, which you can then paste into actual Desmos and save as your own graph.
When you paste them all in they will all be in randomly chosen colors. You can set all of the expressions to the color that you want by pasting in the following to the developer console:
state = Calc.getState()
expressions = state.expressions.list

color = "#000000" //Color to set all expressions

for (var i = 0; i < expressions.length; i++) {
  expressions[i].color = color
}

Calc.setState(state)
This script will get the current state, alter it so that all expressions are displayed as the given color, and then set that altered state to the calculator.