

Generate beautiful, publication-ready figures with the power of Tikz and pgfplots, with a comfortable, familiar Python syntax.
pykz aims to provide a syntax similar to matplotlib, but with the possibility of directly generating (and controlling!) your tikz code.
The benefit over alternatives like tikzplotlib is that pykz was designed explicitly with pgfplots in mind, whereas the goal of tikzplotlib is to map matplotlib concepts to pgfplots. The latter is arguably more convenient if you already have code for matplotlib, but it often still requires manual tweaking to the resulting tex-files. pykz aims to provide more control over the final output directly in Python, so no manual tweaking is required afterwards.
Pykz has a simple, matplotlib-like interface for basic plotting.
import numpy as np
import pykz

x = np.linspace(0, 10, 100)
y = np.sin(x)

pykz.plot(x, y)

# (Optional) save the tikz code to a file.
pykz.save("test-basic-plot.tex")

# Save the Tikz code to a temporary file, compile it, and open the pdf in the default viewer.
pykz.preview()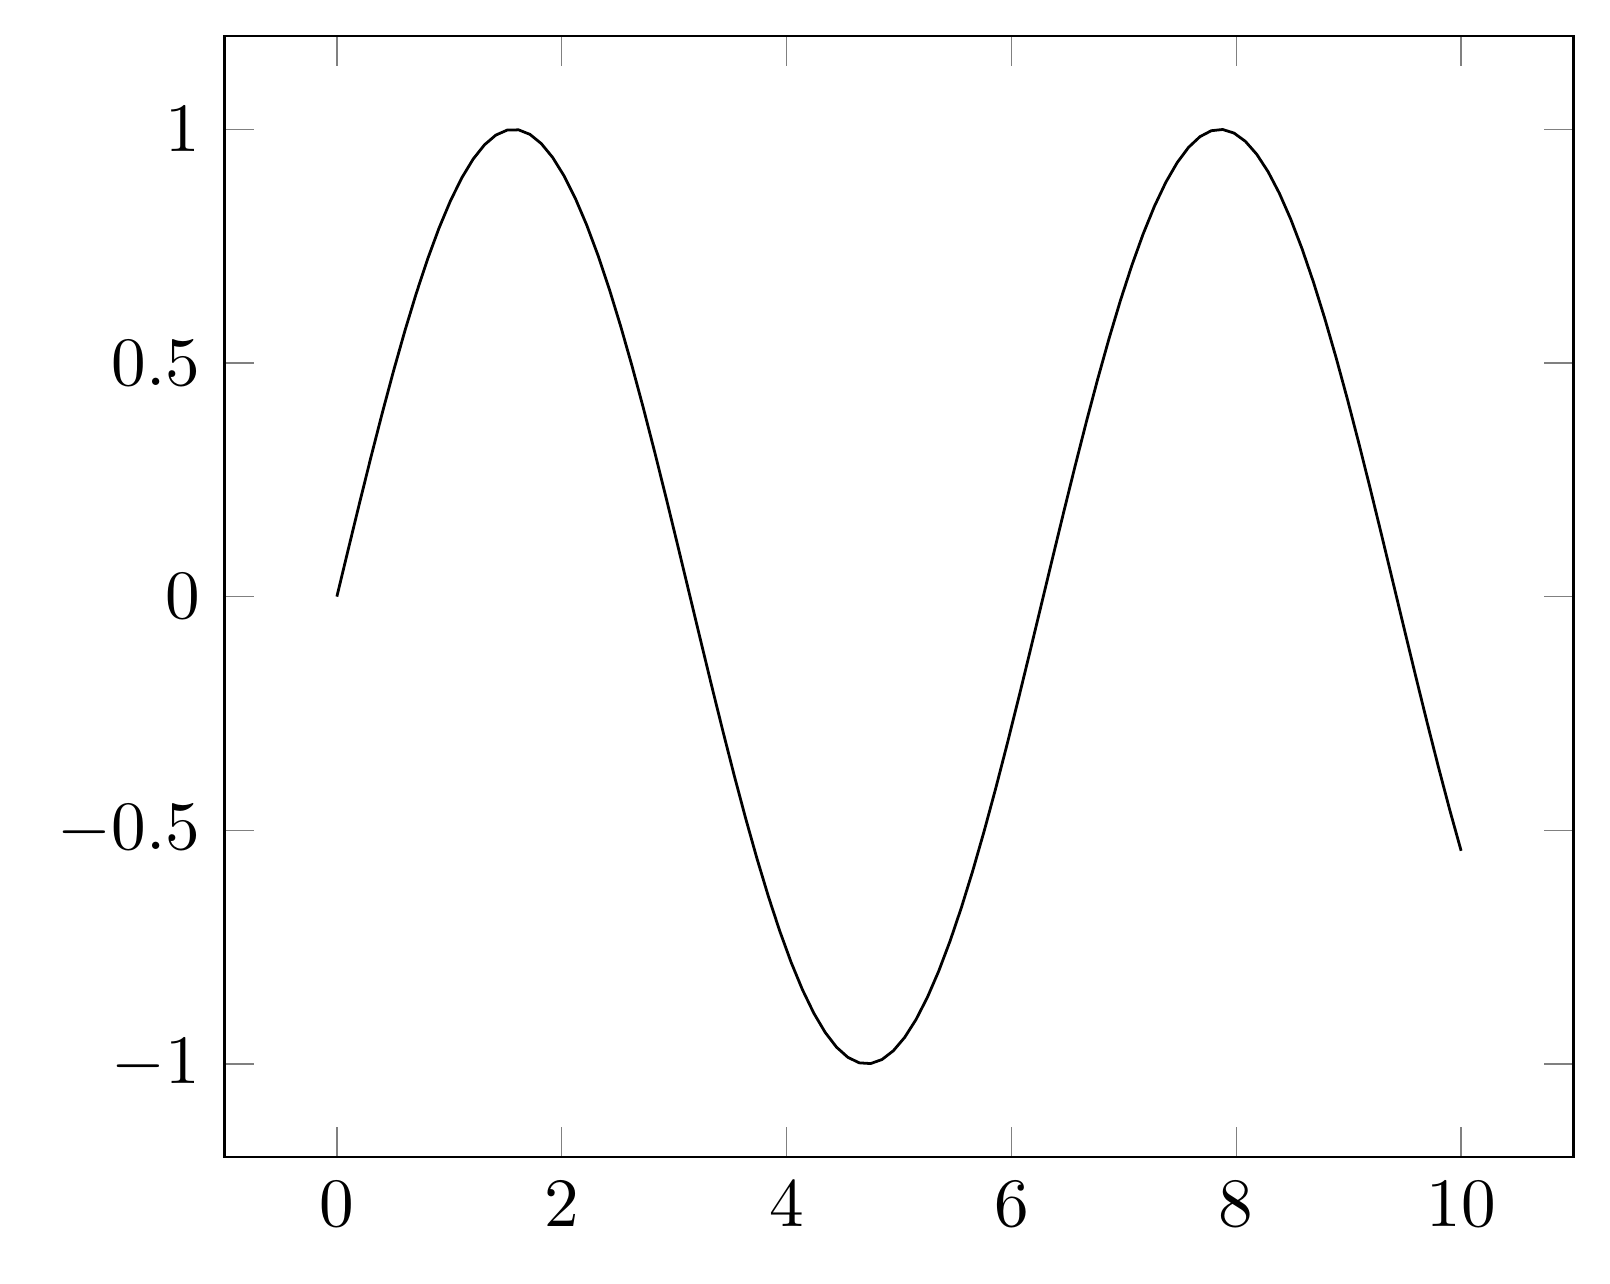
Alternatively, you can use standard TikZ drawing primitives, without using pfgplots. Options passed to the TikZ command are passed as keyword arguments.
import pykz

rect = pykz.rectangle((-1, -1), (1, 1))
circle = pykz.circle((2, 0), (1), fill="red")

rect2 = pykz.rectangle((1, 1), (2, 3), fill="cyan")

# Dump the generated tikz code to the stdout.
print(pykz.dumps())

# Save the Tikz code to a temporary file, compile it, and open the pdf in the default viewer.
pykz.preview()
out:
\documentclass[tikz]{standalone}

\begin{document}
\begin{tikzpicture}
\draw(-1.000000000, -1.000000000) rectangle (1.000000000, 1.000000000);
\draw[fill=red](2.000000000, 0.000000000) circle (1);
\draw[fill=cyan](1.000000000, 1.000000000) rectangle (2.000000000, 3.000000000);

\end{tikzpicture}
\end{document}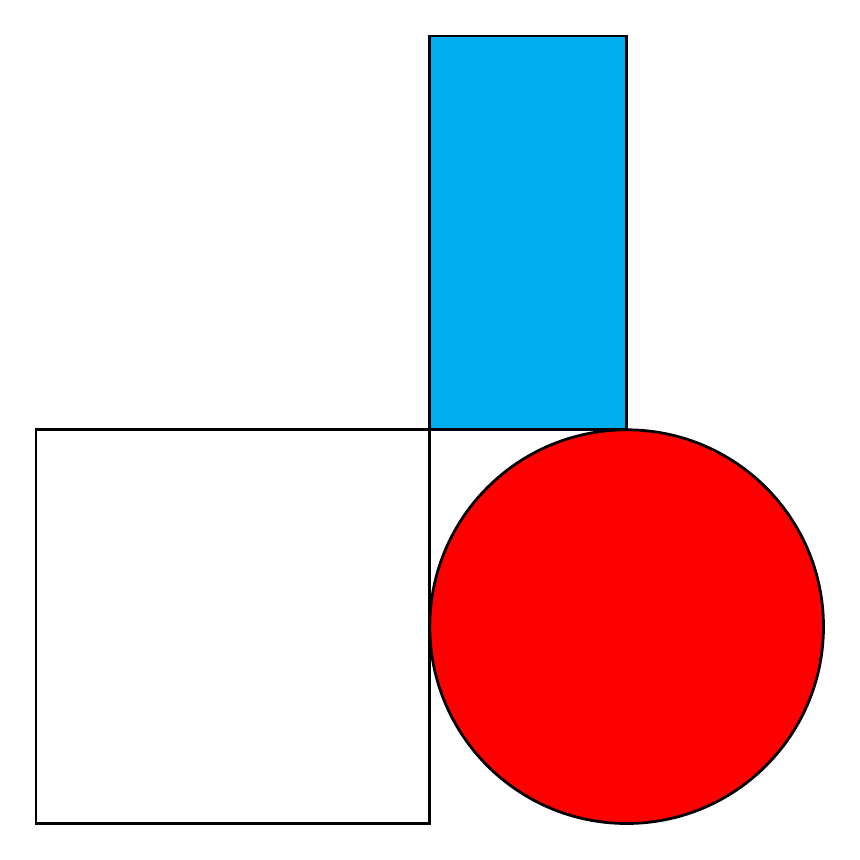
More examples can be found in the online documentation.