3d plotting for Python in the Jupyter notebook based on IPython widgets using WebGL.
Ipyvolume currenty can
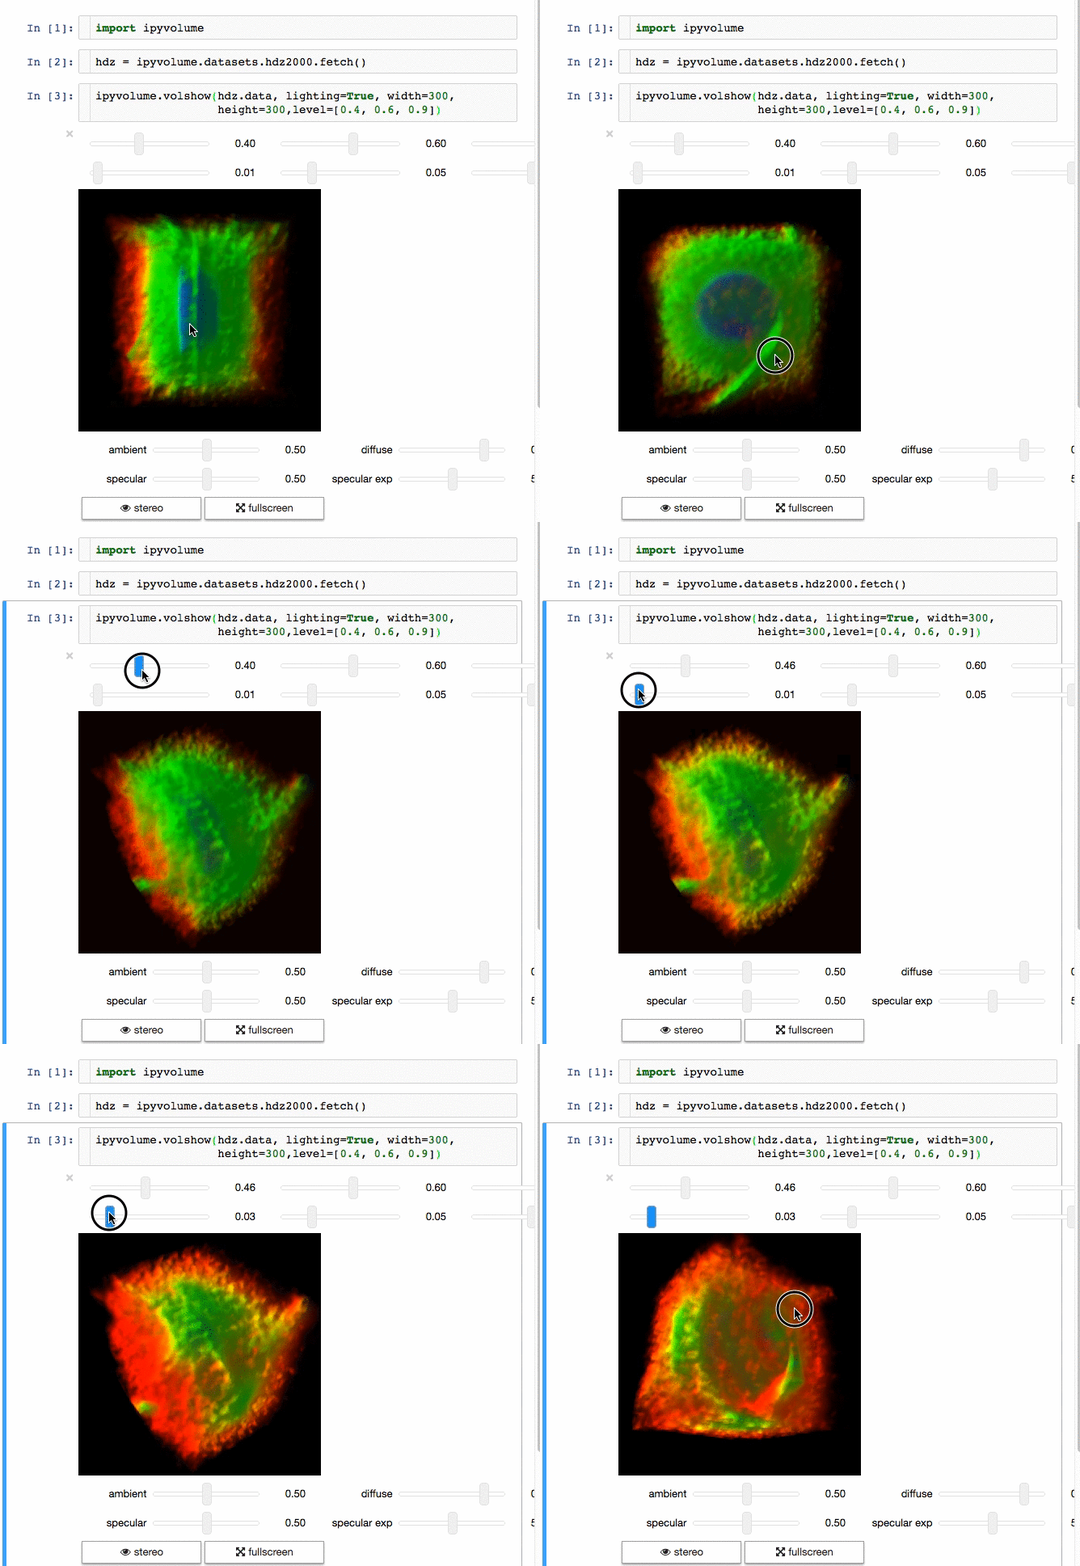
- Do (multi) volume rendering.
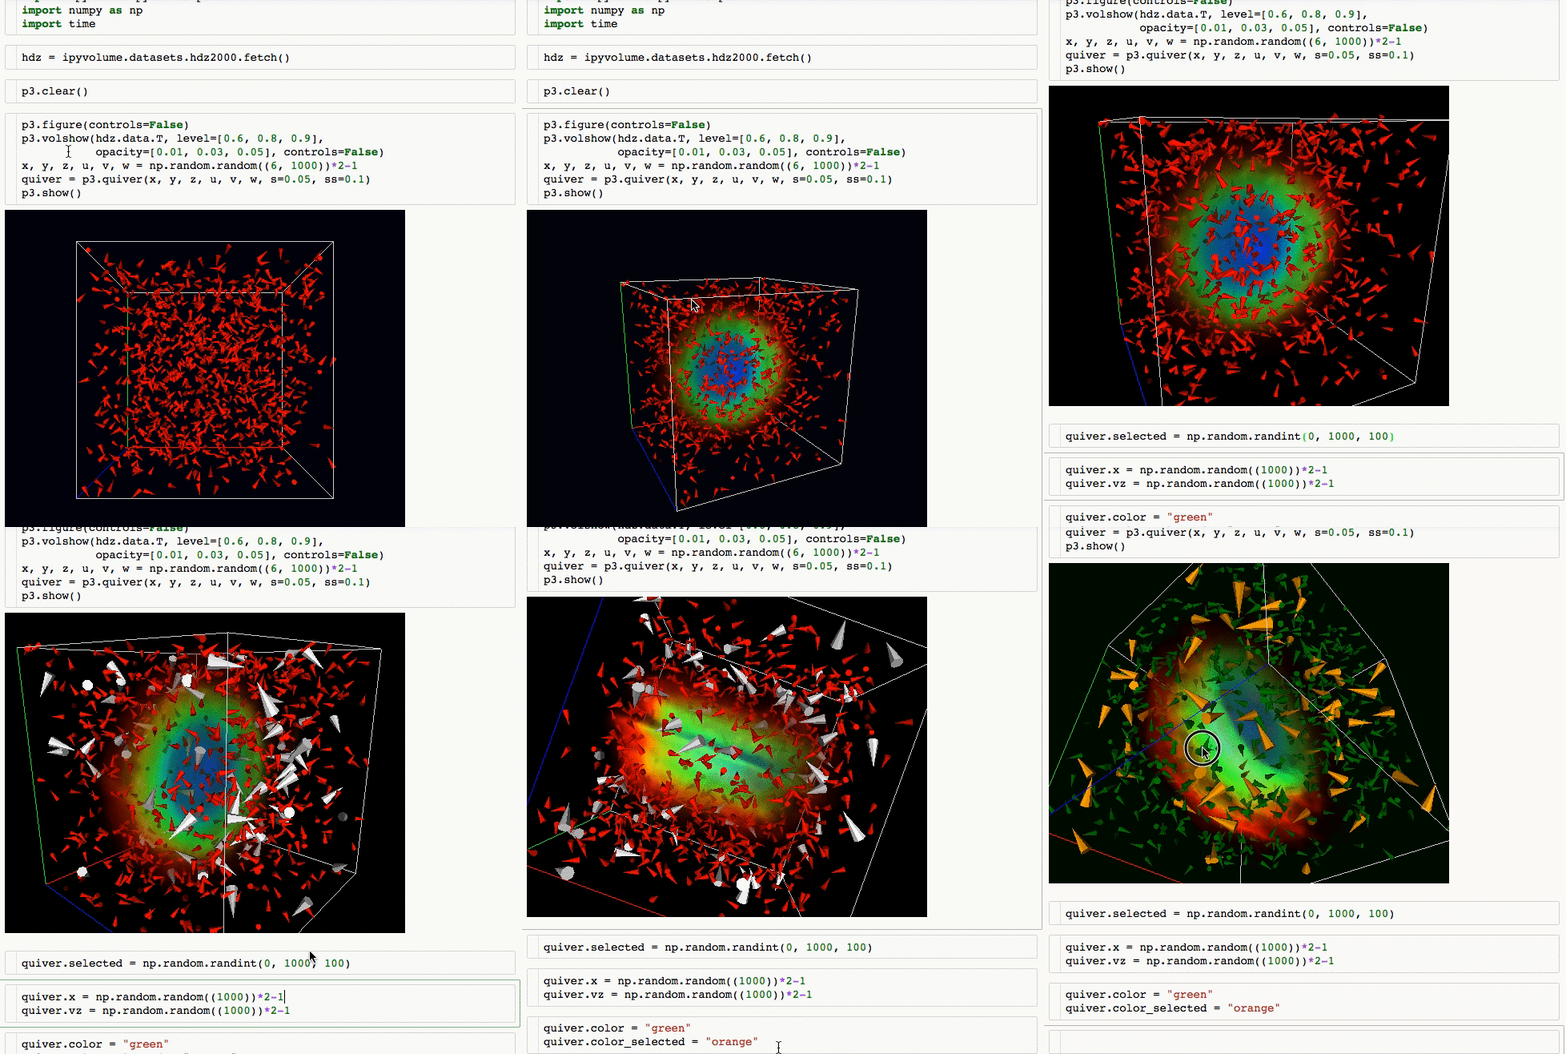
- Create scatter plots (up to ~1 million glyphs).
- Create quiver plots (like scatter, but with an arrow pointing in a particular direction).
- Render isosurfaces.
- Do lasso mouse selections.
- Render in the Jupyter notebook, or create a standalone html page (or snippet to embed in your page).
- Render in stereo, for virtual reality with Google Cardboard.
- Animate in d3 style, for instance if the x coordinates or color of a scatter plots changes.
- Animations / sequences, all scatter/quiver plot properties can be a list of arrays, which can represent time snapshots.
- Stylable (although still basic)
- Integrates with
- ipywidgets for adding gui controls (sliders, button etc), see an example at the documentation homepage
- bokeh by linking the selection
- bqplot by linking the selection
Ipyvolume will probably, but not yet:
- Render labels in latex.
- Show a custom popup on hovering over a glyph.
Documentation is generated at readthedocs:
(see more at the documentation)
If you want to use Jupyter Lab, please use version 3.0.
Advice: Make sure you use conda or virtualenv. If you are not a root user and want to use the --user argument for pip, you expose the installation to all python environments, which is a bad practice, make sure you know what you are doing.
$ pip install ipyvolume
$ conda install -c conda-forge ipyvolume
If you are still using an old notebook version, ipyvolume and its dependend extension (widgetsnbextension) need to be enabled manually. If unsure, check which extensions are enabled:
$ jupyter nbextention list
If not enabled, enable them:
$ jupyter nbextension enable --py --sys-prefix ipyvolume
$ jupyter nbextension enable --py --sys-prefix widgetsnbextension
You have been warned, do this only if you know what you are doing, this might hunt you in the future, and now is a good time to consider learning virtualenv or conda.
$ pip install ipyvolume --user
$ jupyter nbextension enable --py --user ipyvolume
$ jupyter nbextension enable --py --user widgetsnbextension
$ git clone https://github.com/maartenbreddels/ipyvolume.git
$ cd ipyvolume
$ pip install -e .
$ jupyter nbextension install --py --overwrite --symlink --sys-prefix ipyvolume
$ jupyter nbextension enable --py --sys-prefix ipyvolume
# for jupyterlab (>=3.0), symlink share/jupyter/labextensions/bqplot-image-gl
$ jupyter labextension develop . --overwrite
Note: There is never a need to restart the notebook server, nbextensions are picked up after a page reload.
Start this command:
$ (cd js; npm run watch)
It will
- Watch for changes in the sourcecode and run the typescript compiler for transpilation of the
srcdir to thelibdir. - Watch the lib dir, and webpack will build (among other things),
ROOT/ipyvolume/static/index.js.
Refresh the page.


