Holt-Winters forecasting is a way to model and predict the behavior of a sequence of values over time—a time series.
⚡ I have created a new python library which makes TSA easier and faster, do check it out @ Pytsal
Before getting into the analysis of the real-time series model let's understand a few basic concepts required to have a deeper understanding of the topic.
A time series is a sequence of numerical data points in successive and chronological order. Generally, the x-axis or index is taken as time and the y-axis or value represents the value for the corresponding x value.
- Level - the typical value or the average
- Trend - the slope at that instance
- Seasonality - cyclical repeating pattern
Before knowing what is exponential smoothing lets understand why it's required.
The real-world datasets for time series are hard to forecast and generally, it's assumed that data of recent past have higher significance compared to old data, hence more weightage is given to recent data than older data.
The problem faced with weighted moving average is choosing the appropriate weights for each level.
Exponential smoothing uses EWMA (Exponential Weighted Moving Average), i.e older data have lesser contribution compared to newer data. In EWMA weights reduce exponentially overtime and provide reasonable weights for each level.
If you have some time series xt, you can define a new time series st that is a smoothed version of xt.
The following graph with α=0.5 shows how weights of older data diminish over time. The black bars denote the actual value(xt) and colored bars denote the smoothened value(st).

Holt's model or Double Exponential Smoothing is an extension to simple exponential smoothing.
- SES assumes the time series to be stationary,i.e it assumes the statistical properties such as the mean, variance and autocorrelation are all constant over time.
- But in general, a majority of time series have either trend or seasonality component, thus forecasts made by SES are unproductive.
Holt's model overcomes the drawback of SES by considering both level and trend component. The term double exponential smoothing was coined because exponential smoothing is performed both on level and trend component.
- F - the forecast at time t.
- D - the actual value at time t.
- a - level at time t.
- b - trend/slope component at time t.
- α - smoothing parameter for level.
- β - smoothing parameter for trend.
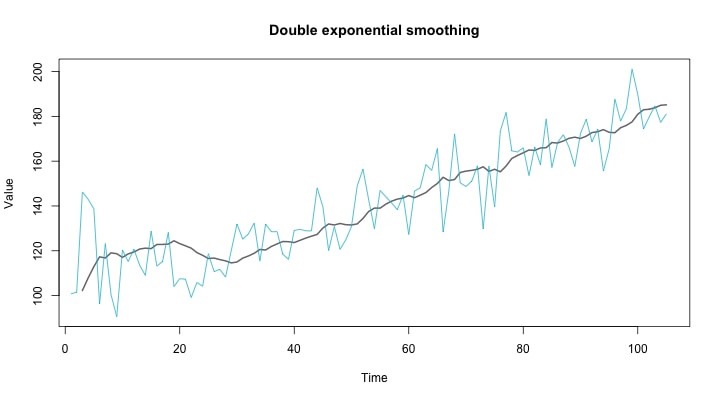
The following graph illustrates how holt's model is used to forecast time series having a trend component.
- Linear Regression is an effective method used to predict data points. The downside is that it considers all data with the same weightage.
- This property of LR isn't suitable for time series data, hence holt's is preferred over LR for time series analysis as the model uses the exponential smoothing.
Holt-Winter model is an extension of Holt's model. This takes into account all the 3 time-series components (level, trend and seasonality). The seasonality component of time series is an important component since most real-world data have a seasonal period.
Holt-Winter additive model is preferred when the time series shows constant or roughly constant seasonality over time.
- F - the forecast at time t.
- D - the actual value at time t.
- a - level at time t.
- b - trend/slope component at time t.
- c - seasonal component at time t.
- α - smoothing parameter for level.
- β - smoothing parameter for trend.
- γ - smoothing parameter for seasonality.
- p - period for the time series.
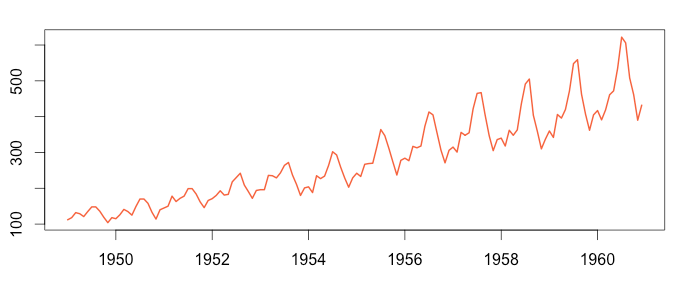
The following graph illustrates how the Holt-Winter additive model is used to predict seasonal data having a constant seasonality of period=12 or 1 year.

Holt-Winter multiplicative is useful in cases when the time series has the seasonality component changing over time.
The following graph illustrates how the multiplicative model is used to generate forecasts to predict seasonal data having the seasonal component changes over time.
Anomaly detection problem for time series is usually formulated as finding outlier data points relative to some standard.
The algorithm is an extension to Holt-Winter model. The data points within the confidence bands are considered to be normal and data points outside the bands are considered to be anomalies.
- UB - upper confidence band.
- LB - lower confidence band.
- a - level at time t.
- b - trend/slope component at time t.
- c - seasonal component at time t.
- γ - smoothing parameter for seasonality.
- p - period for the time series.
- m - brutlag scaling factor.
The following graphs illustrates how Holt-Winter's model and brutlag algorithm are used to identify anomalies present in the time series.

- Forecasting: Principles and Practice, Rob J Hyndman and George Athanasopoulos
- Introduction to Time Series and Forecasting, Peter J. Brockwell and Richard A. Davis
- Pytsal Forecasting
- Pytsal Anomaly detection
- Exponential smoothing for time series forecasting
- statsmodel.tsa.holtwinters module
- Stationarity in time series
- Brutlag algorithm
Ok!, that's a lot of theory and math, let's get started with the analysis.
git clone https://github.com/KrishnanSG/holt-winters.git
cd holt-winters/
pip install -r requirements.txt
The notebook contains the sales data analysis along with the following:
- What is seasonal decomposition of a time series?
- Model selection and validation.
- Model summary and conclusion.
For those who prefer python script over jupyter notebook.
python analysis.pyanomaly_detection.py script contains the implementation of brutlag algorithm to find anomalies in average temperature of India dataset.
python anomaly_detection.py
anomaly_detection.ipynb notebook contains a detailed analysis of anomaly detection using Holt-Winter model and brutlag algorithm.
Note: The datasets used for the analysis can be found under the dataset folder.
Krishnan S G