
House Rocket, located in seattle, is a company that specializes in buying and selling real estate, making its profit in this process
Currently, real estate choices are made manually by a team of company specialists, however, due to the complexity and cost of evaluating the profit potential of a property with so many options in the portfolio, the company has an extremely unpredictable cash flow, driving investors away.
The assumptions about the business problem is as follows:
- The National Realtors Association forecasts that sales prices of existing homes will average $ 218,500 this year, 5% higher than the $ 208,000 of 2014, and that new and existing home sales might reach 5.83 million in 2015, higher than in any year since the recession.
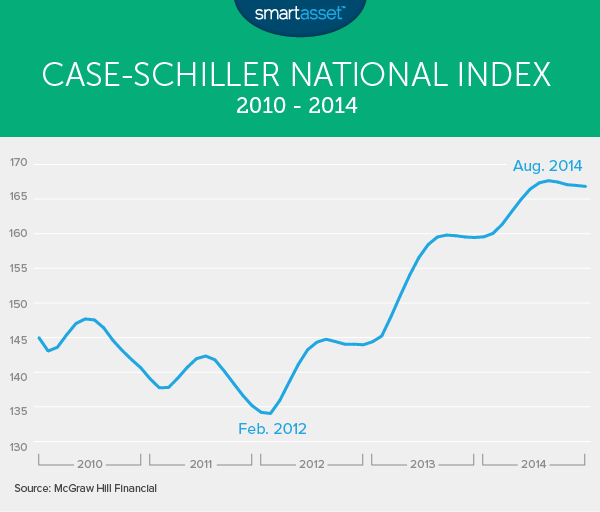
- The national Case-Schiller index tracks repeat-sales home prices across the country. It reflected national price growth of 1.3% in 2012, 9.6% in 2013 and 6.6% in 2014.
My strategy to solve this challenge was:
Step 01. Data Description: My goal is to use statistics metrics to identify data outside the scope of business.
Step 02. Feature Engineering: Derive new attributes based on the original variables to better describe the phenomenon that will be modeled.
Step 03. Data Filtering: Filter rows and select columns that do not contain information for modeling or that do not match the scope of the business.
Step 04. Exploratory Data Analysis: Explore the data to find insights and better understand the business
Step 05. Convert Analysis to Business Values: Convert the analysis that i´ve do into a business result.
- Group data by region (zipcode)
- Within each region, I will find the median real estate price
- I will suggest that the properties that are below the median price of each region and that are in good condition are purchased
- Group the properties by region (zipcode) and by seasonality (Summer, winter)
- Set sales price:
-
If the purchase price is higher than the region's median + seasonality:
- Sale price will be equal to the purchase price + 10%
-
If the purchase price is less than the region's median + seasonality:
- Sale price will be equal to the purchase price + 30%
-
Step 6. Deploy Modelo to Production: Publish the model in a cloud environment so that other people or services can use the results to improve the business decision.
Hypothesis 01: Does the season that you sell influence price?
True. As observed, on average, properties sold in the summer are 22,000 more expensive
Hypothesis 02: The valuation of the zipcode influences the price of the property?
True. As observed, the cheapest zip code is, on average, 230k the price of the property, while the most expensive is 1.4m
Hypothesis 03: If the condition of the property is bad, is it more than 30% devalued, in the mean?
True. As observed, if the condition of the house is "bad" it is, on average, ≅40% cheaper than the condition of good condition
Let's recap how many properties the House Rocket business team must analyze in this data set provided and how long they would take a decision, on average
- let's consider that a professional can say in 1,5 min if that property can pass for a more refined analysis
| Before-After | Dataset size | Analysis time |
|---|---|---|
| Before | 21613 | 22 days |
| After | 5629 | 6 days |
Our full original dataset contains records for 21k properties. Suppose we are going to analyze all of them and decide which ones to buy, our result achieved a profit of 23% in relation to the properties purchased, which is higher than ≅15% that is usually obtained in a property sale. Thus, translating to commercial numbers. ( Reference )
| Profit | Percentage | |
|---|---|---|
| WhichProperty | $627.113.399 | 22,9% |
This means that having a portfolio of 21k properties that would go through the selection of the model to check whether or not to buy it, in the worst expected scenario the portfolio would generate a profit of $ 627 million, much faster than it is today, having scope to analyze more possible purchases of House Rocket
- Put more filters in the analysis of properties
- Implement ML models to improve the analysis