DNA Features Viewer (full documentation here) is a Python library to visualize DNA features, e.g. from GenBank or GFF files, or Biopython SeqRecords:
DNA Features Viewer automatically produce simple and clear plots even for sequences with many overlapping features and long labels. The libray plays well with Matplotlib and Biopython, and the plots can be output to many different formats (PNG, JPEG, SVG, PDF), e.g. for report generation, article figures, or LIMS interfaces.
If you have PIP installed, just type in a terminal:
pip install dna_features_viewerDNA Features Viewer can be installed by unzipping the source code in one directory and using this command:
python setup.py installIf you intend to use the bokeh features, you need to also install Bokeh and Pandas:
pip install bokeh pandasTo parse GFF files, install the bcbio-gff library:
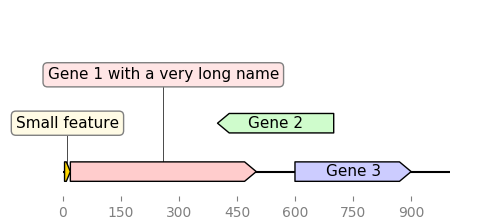
pip install bcbio-gffIn this first example we define features "by hand":
from dna_features_viewer import GraphicFeature, GraphicRecord
features=[
    GraphicFeature(start=0, end=20, strand=+1, color="#ffd700",
                   label="Small feature"),
    GraphicFeature(start=20, end=500, strand=+1, color="#ffcccc",
                   label="Gene 1 with a very long name"),
    GraphicFeature(start=400, end=700, strand=-1, color="#cffccc",
                   label="Gene 2"),
    GraphicFeature(start=600, end=900, strand=+1, color="#ccccff",
                   label="Gene 3")
]
record = GraphicRecord(sequence_length=1000, features=features)
record.plot(figure_width=5)
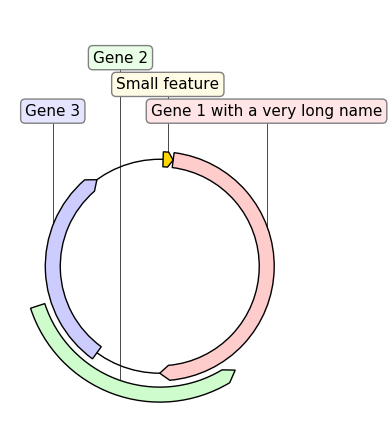
If we replace GraphicRecord by CircularGraphicRecord in the code above we obtain a circular plot of the construct:
It is also possible to generate interactive (browser-based) plots by using plot_with_bokeh instead of plot:
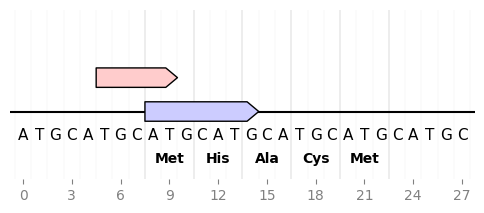
DNA Features Viewer allows to plot nucleotide or amino acid sequences under the record plot:
from dna_features_viewer import GraphicFeature, GraphicRecord

sequence = "ATGCATGCATGCATGCATGCATGCATGC"
record = GraphicRecord(sequence=sequence, features=[
    GraphicFeature(start=5, end=10, strand=+1, color='#ffcccc'),
    GraphicFeature(start=8, end=15, strand=+1, color='#ccccff')
])

ax, _ = record.plot(figure_width=5)
record.plot_sequence(ax)
record.plot_translation(ax, (8, 23), fontdict={'weight': 'bold'})
ax.figure.savefig('sequence_and_translation.png', bbox_inches='tight')
This enables for instance to plot an overview of a sequence along with a detailed detail of a sequence subsegment (full code)
...
record.plot(ax=ax1)
cropped_record = record.crop((zoom_start, zoom_end))
cropped_record.plot(ax=ax2)
cropped_record.plot_sequence(ax=ax2)
cropped_record.plot_translation(ax=ax2, location=(408, 423))DnaFeaturesViewer plays nice with BioPython. As a result it is super easy to plot the content of a Biopython record, or directly a GenBank (or GFF) file:
from dna_features_viewer import BiopythonTranslator
graphic_record = BiopythonTranslator().translate_record("my_sequence.gb")
ax, _ = graphic_record.plot(figure_width=10, strand_in_label_threshold=7)
Note 1: the script uses strand_in_label_threshold=7 to indicate the strand with
an arrow in the annotation text for every feature less than ~7 pixels in width.
Note 2: the BiopythonTranslator class determines how the genbank information is
transformed into graphical features. It enables to chose which categories of
features to plot, the color of the different features.
Note 3: parsing GFF files requires the BCBio library
(pip install bcbio-gff). This library also enables to extract Biopython
records from GFF files containing several records (using GFF.parse("records.gff")).
As it uses Matplotlib, DNA Features Viewer can display the features on top of other sequences statistics, such as the local GC content:
import matplotlib.pyplot as plt
from dna_features_viewer import BiopythonTranslator
from Bio import SeqIO
import numpy as np

fig, (ax1, ax2) = plt.subplots(
    2, 1, figsize=(12, 3), sharex=True, gridspec_kw={"height_ratios": [4, 1]}
)

# PLOT THE RECORD MAP
record = SeqIO.read("example_sequence.gb", "genbank")
graphic_record = BiopythonTranslator().translate_record(record)
graphic_record.plot(ax=ax1, with_ruler=False, strand_in_label_threshold=4)

# PLOT THE LOCAL GC CONTENT (we use 50bp windows)
gc = lambda s: 100.0 * len([c for c in s if c in "GC"]) / 50
xx = np.arange(len(record.seq) - 50)
yy = [gc(record.seq[x : x + 50]) for x in xx]
ax2.fill_between(xx + 25, yy, alpha=0.3)
ax2.set_ylim(bottom=0)
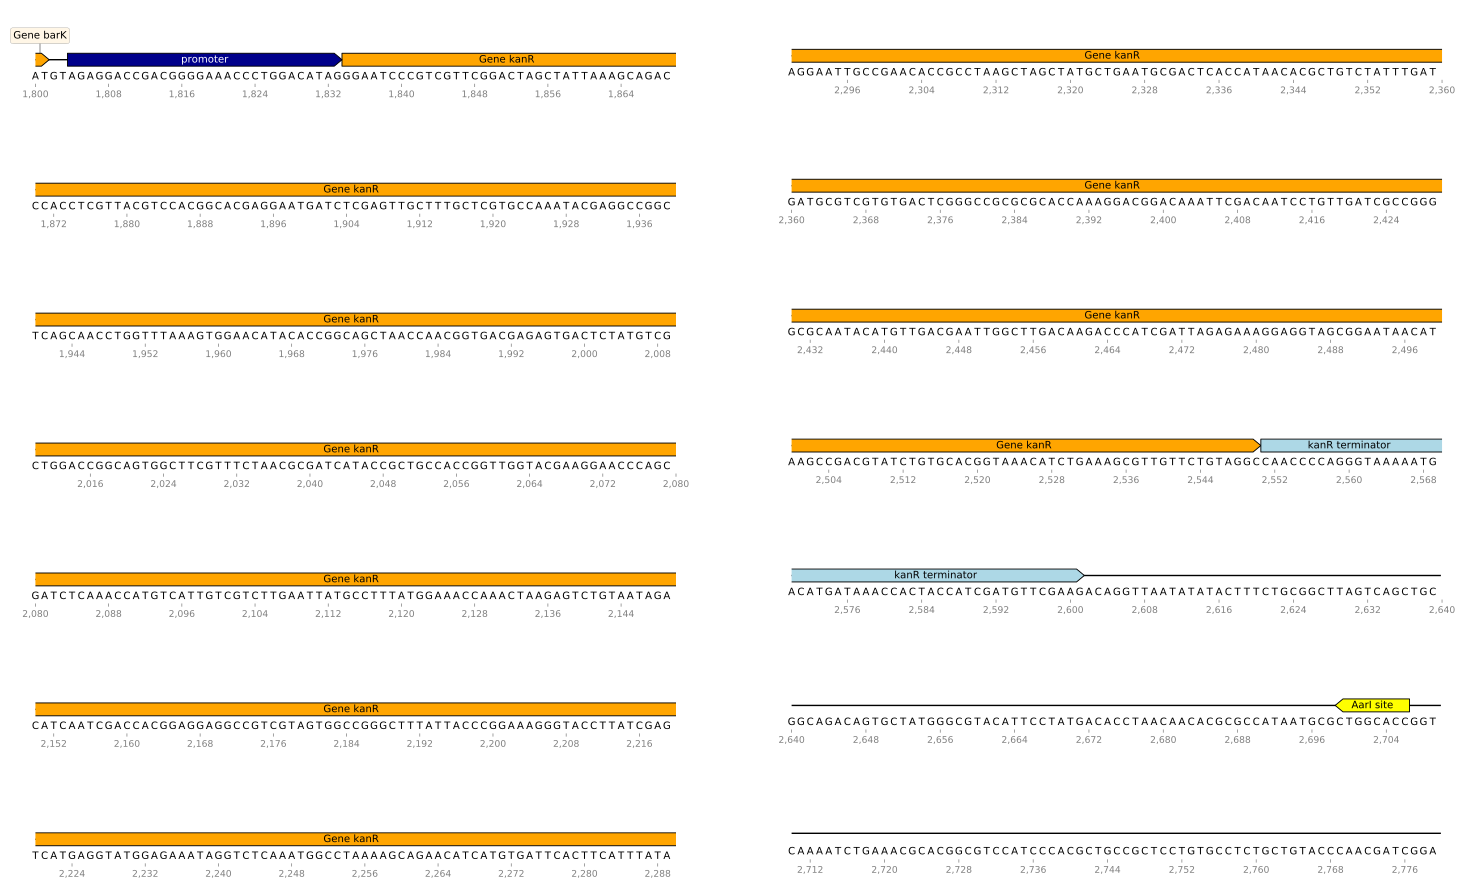
ax2.set_ylabel("GC(%)")Since v3.0 it is possible to plot a sequence over multiple lines (using record.plot_on_multiple_lines()) or even on multiple pages (of a PDF):
graphic_record.plot_on_multiple_pages(
    "multipage_plot.pdf",
    nucl_per_line=70,
    lines_per_page=7,
    plot_sequence=True
)DNA Features Viewer allows to define "themes" by using custom record translators
instead of the default BiopythonTranslator. Here is an example:
from dna_features_viewer import BiopythonTranslator

class MyCustomTranslator(BiopythonTranslator):
    """Custom translator implementing the following theme:

    - Color terminators in green, CDS in blue, all other features in gold.
    - Do not display features that are restriction sites unless they are BamHI
    - Do not display labels for restriction sites
    - For CDS labels just write "CDS here" instead of the name of the gene.

    """

    def compute_feature_color(self, feature):
        if feature.type == "CDS":
            return "blue"
        elif feature.type == "terminator":
            return "green"
        else:
            return "gold"

    def compute_feature_label(self, feature):
        if feature.type == 'restriction_site':
            return None
        elif feature.type == "CDS":
            return "CDS here"
        else:
            return BiopythonTranslator.compute_feature_label(self, feature)

    def compute_filtered_features(self, features):
        """Do not display promoters. Just because."""
        return [
            feature for feature in features
            if (feature.type != "restriction_site")
            or ("BamHI" in str(feature.qualifiers.get("label", '')))
        ]


graphic_record = MyCustomTranslator().translate_record("example_sequence.gb")
ax, _ = graphic_record.plot(figure_width=10)
ax.figure.tight_layout()
ax.figure.savefig("custom_bopython_translator.png")This GIF uses DNA Features Viewer to plot the progress in the optimization of a DNA sequence with DNA Chisel. It also uses Proglog to automatically generate a picture at different time points. See the not-so-great python code for this example on Gist.
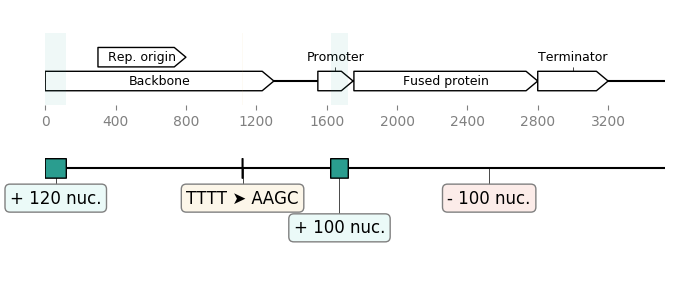
GeneBlocks is a Python library which computes "diffs" of constructs two sequences, indicating all the changes (additions, deletions, mutations). It uses DNA Features Viewer to display these changesx along with the other sequence's features.
DNA Features Viewer is an open-source software originally written at the Edinburgh Genome Foundry by Zulko and released on Github under the MIT licence. Everyone is welcome to contribute !

DNA Features Viewer is part of the EGF Codons synthetic biology software suite for DNA design, manufacturing and validation.

