Chart Builder is an Open Source HTML5 based Tool. Create your first PHP Chart with this great Tool which is an Open Source HTML5, a PHP based application built in Apache + PHP + MySQL + Free Charting Engine, which is designed with simplicity and ease-of-use at top of the mind which is customizable in a number of ways. It supports a variety of different charts, and can be used to create either static or real-time dashboards with data coming from a variety of sources such as MySQL, MS SQL, SQLite, ORACLE, PostgreSQL, Sybase and Cubrid with no programming skills. A part of the community, This Chart Builder is designed to integrate with a PHP application you may already be using.
Figuring out how to best visualize your data can be challenging. Maybe you started out by creating a few graphs in a spreadsheet and are trying to find a way to tie them all together. Or maybe you're working with an existing analytics tool and want to find a way to make your data more accessible to a wider audience. Or perhaps you've gone several real-time sources and are trying to find a way to tie them all together.
Fortunately, there is a PHP based Open Source HTML5 Chart Builder is available that make the job much easier. On one end of the spectrum are community application, like BIRT or Pentaho. But for a smaller project, tools like these could be overkill, and in some cases, you might be able to find a dashboard tool that is already designed to work with the kind of data you are dealing with.
- PHP Version 5.6 or later
- Apache 2 or later
- Windows 7 or later /Linux 3 or later
- Firefox 52, Chrome 57, IE 8
- Download from https://dashboardbuilder.net/download-free-dashboard
- Place the files in a directory on the web server. e.g. …/www/dashboar/dbuilder/
- Unzip the file using Extract Here option to the root folder of "dashboardbuilder"
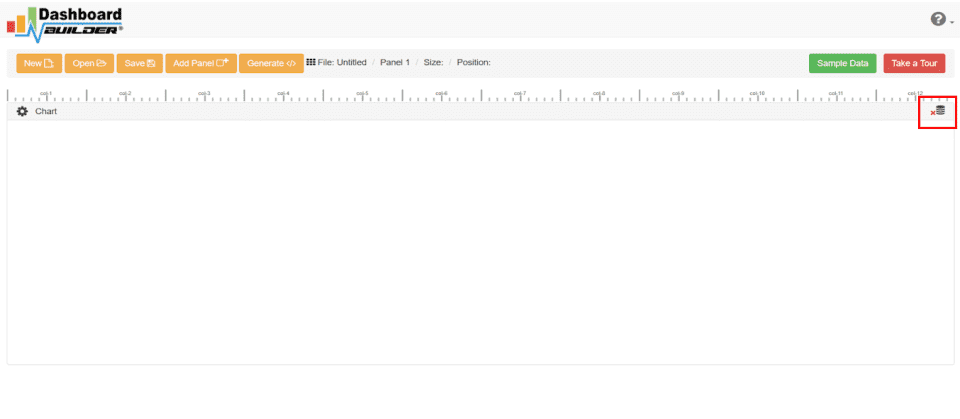
- Run the web folder in your browser. e.g. http://localhost/dashboarduiler following welcome screen will appear.
- Now Click the Database icon.
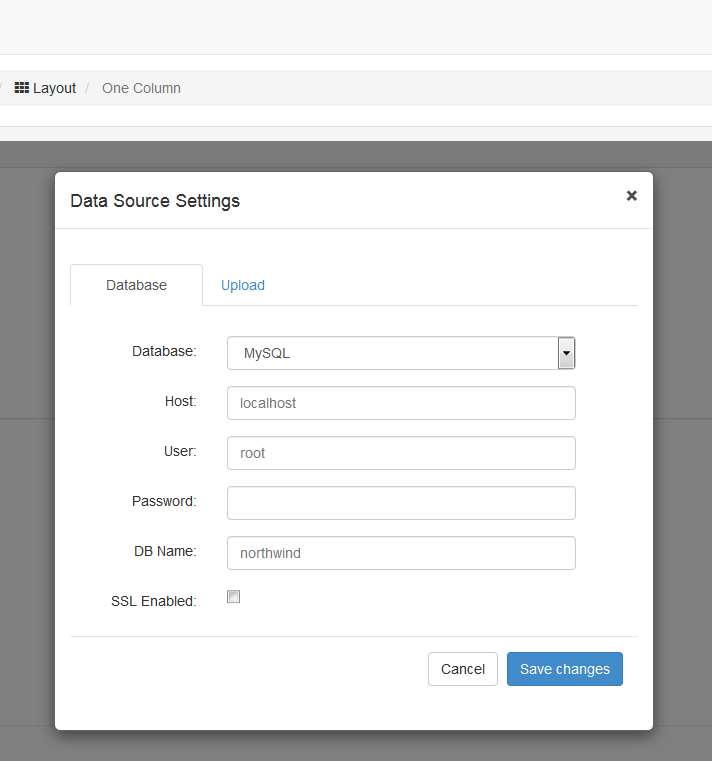
- Following screen will appear. Select Database from data source tab. Select SQLite from the drop down list of Database, Enter your ''../data/Northwind.db'' in the DB name field and
Save changesas mentioned in the screen.
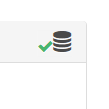
- A green tick mark with Database will appear when your database is successfully connected.
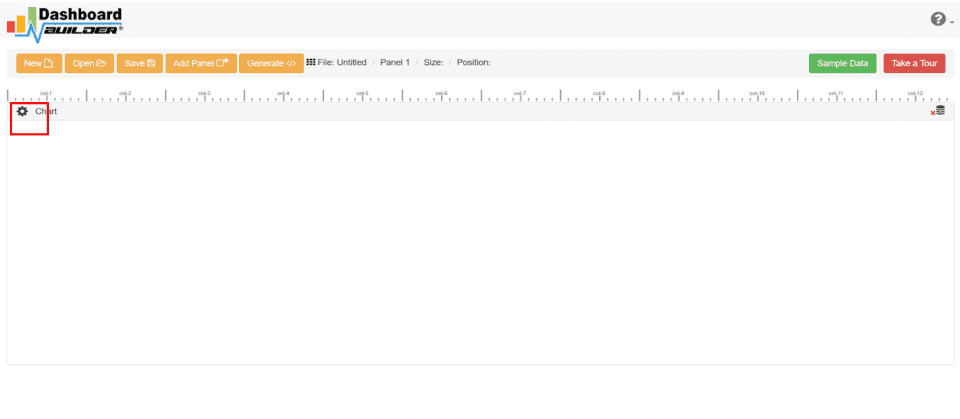
- Select the gear icon for your Chart preference.
- The following screen will appear. List of the tables will appear.
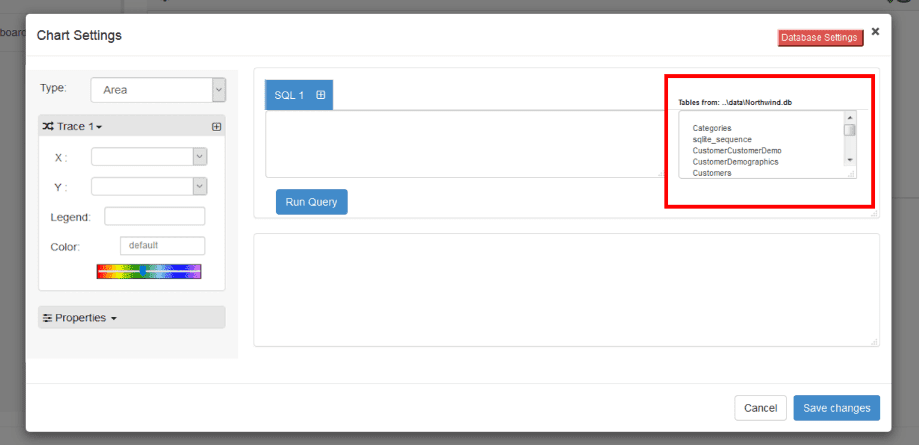
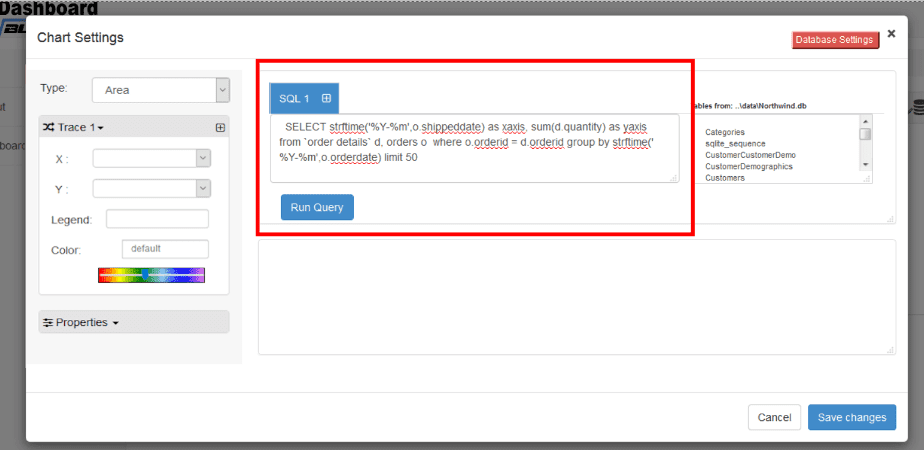
- Enter your SQL statement in text box, SQL field as the following manner
SELECT strftime('%Y-%m',o.shippeddate) as xaxis, sum(d.quantity) as yaxis from 'order details' d, orders o where o.orderid = d.orderid group by strftime('%Y-%m',o.orderdate) limit 50
- Click the
Run Querybutton
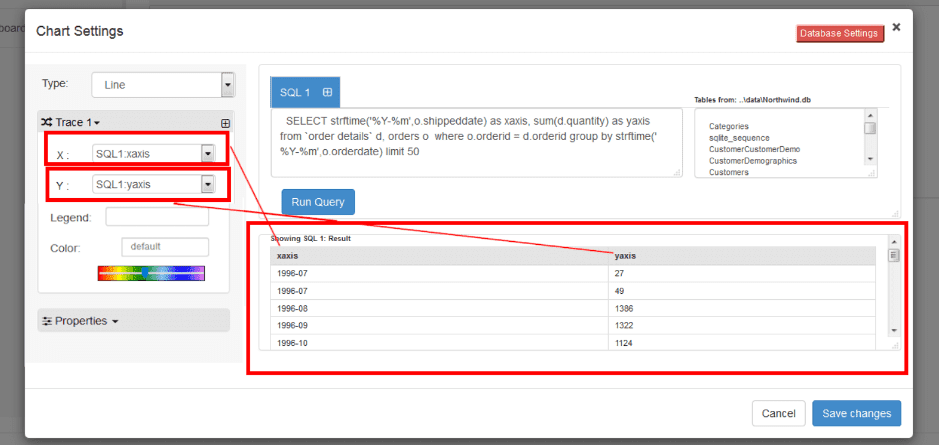
- Query Result will appear. Now Select your x-axis data from the drop down list of
Xand y-axis data from the drop down list ofY. - Click
Save Changes
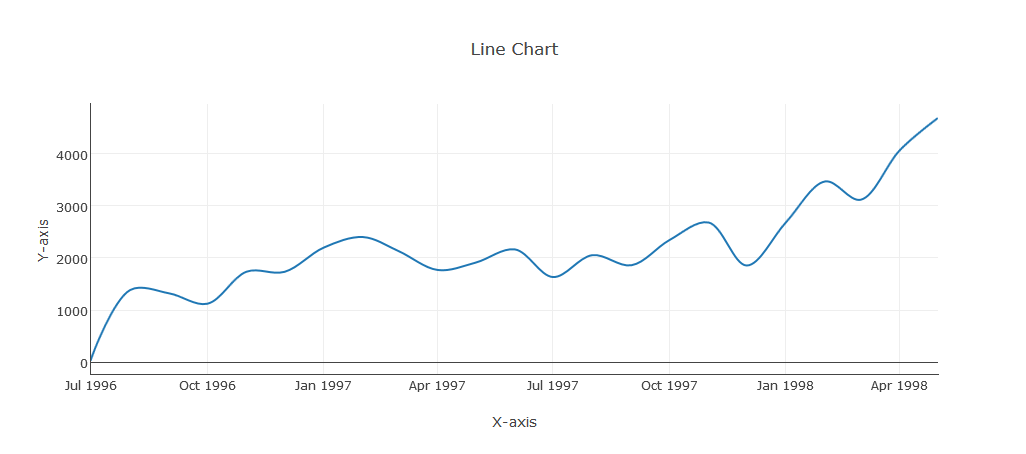
- Charts will be appeared on the screen as shown below.
- Now extend the
Generatebutton and click on thePHP Code
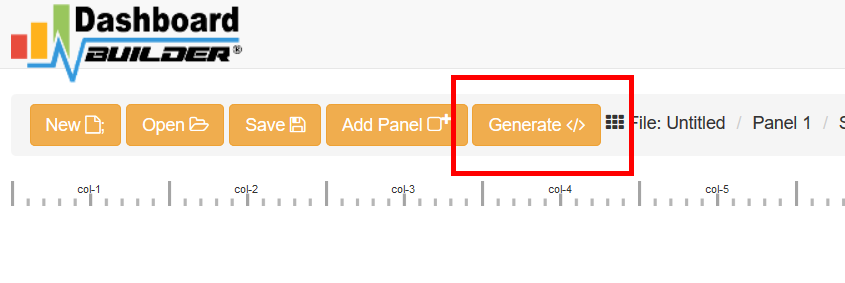
- PHP code for the chart will automatically generate, you may copy past this code to your PHP application.
/**
 * DashboardBuilder
 *
 * @author Diginix Technologies www.diginixtech.com
 * Support  - http://www.dashboardbuilder.net
 * @copyright (C) 2018 Dashboardbuilder.net
 * @version 2.1.7
 * @license: license.txt
 */

include("inc/dashboard_dist.php");  // copy this file to inc folder


// for chart #1
$data = new dashboardbuilder();
$data->type =  "line";

$data->source =  "Database";
$data->rdbms =  "sqlite";
$data->servername =  "";
$data->username =  "";
$data->password =  "";
$data->dbname =  "data\Northwind.db";
$data->xaxisSQL[0]=  "SELECT strftime(^%Y-%m^,o.shippeddate) as xaxis, sum(d.quantity) as yaxis from `order details` d, orders o  where o.orderid = d.orderid group by strftime(^%Y-%m^,o.orderdate) limit 50";
$data->xaxisCol[0]=  "xaxis";
$data->yaxisSQL[0]=  "SELECT strftime(^%Y-%m^,o.shippeddate) as xaxis, sum(d.quantity) as yaxis from `order details` d, orders o  where o.orderid = d.orderid group by strftime(^%Y-%m^,o.orderdate) limit 50";
$data->yaxisCol[0]=  "yaxis";
$data->name = "linechart";
$data->title = "Line Chart";
$data->orientation = "";
$data->xaxistitle = "x-axis title";
$data->yaxistitle = "y-axis title";
$result[0] = $data->result();

?>

<!DOCTYPE html>
<html>
<head>
	<script src="assets/js/dashboard.min.js"></script> <!-- copy this file to assets/js folder -->
	<!--<link rel="stylesheet" href="assets/css/bootstrap.min.css"> Bootstrap CSS file, change the path accordingly -->


</head>
<body>

<div class="container">
<div class="col-lg-12">
<div class="panel panel-default">
<div class="panel-heading"></div>
    <div class="panel-body">
        <?php echo $result[0];?>
    </div>
</div>
</div>
</div>
</body>