Emphasizing discreteness of data in rootograms #360
Description
In their preprint, Säilynoja et al proposed a new look for rootograms that emphasises the discreteness of the data more compared to the version of ppc_rootogram that is currently used in bayesplot. Below, you see an example of the current version of rootogram and the version with proposed changes.
Current version:
Proposed version:
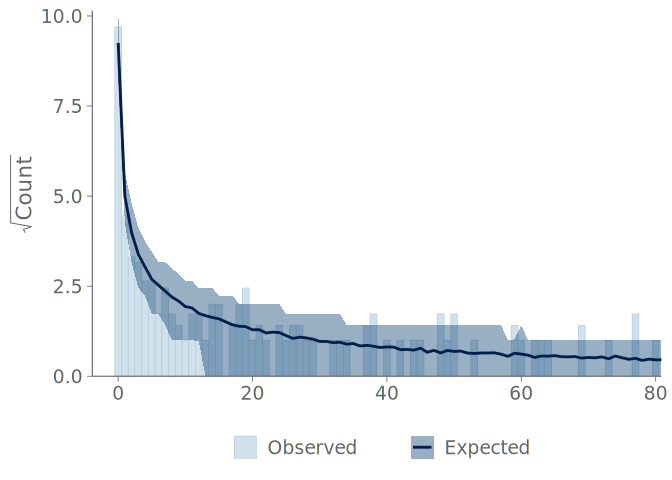
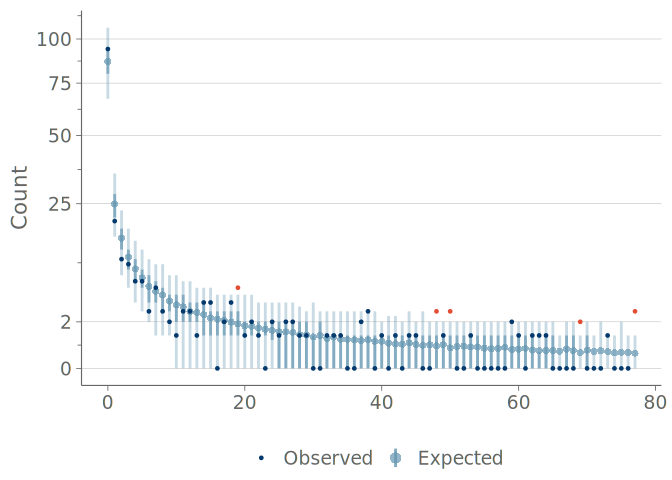
There are two main differences between the current version and the proposed version. First, the proposed version shows predictive frequencies as points and point-wise credible intervals, instead of connected lines and filled areas. This change highlights the discreteness of predictions compared to the current version, which is not explicit about this. Second change is about how square root scaling is implemented on the vertical axis. Currently, the axis is labelled by equal tick marks of square roots of the frequencies, but what is proposed instead is transforming the axis to a square root scale and displaying the untransformed frequencies, which can be seen at the proposed visual.
Both of these changes make sense to me, and to not break graphs that people are already working on, we can implement them connected to a parameter such as discrete, which would be false by default and when it is set to true, it creates rootograms with new, proposed aesthetics. Of course, we can add a warning now to let users know about these changes and deprecate the old version after several releases.