Chart renders incorrectly when using StackedAreaChart with brush and zoom #21
Comments
|
Oh - that is fun. This is general area where this is happening: https://github.com/reaviz/reaviz/blob/master/src/AreaChart/AreaSeries/Line.tsx#L154 IF you turn off animations does it work? |
|
Thanks for the quick response! I tried disabling the animation for the Series and Line, the drawing is faster but the bug still happens. |
|
So I have found out that the issue starts here: I tried different approaches that fix this issue:
I'm no React expert but I think that if one of the solutions directly in the |
|
Ya - can you open up a PR - happy to accept that. |
|
I went with the first solution. |
|
Ya - add a story in the brush stories plz :D |
I'm submitting a...
Current behavior
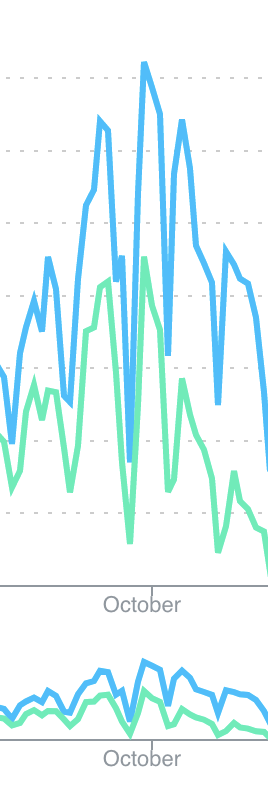
I constructed this demo using a few examples from the stories, and I have the following issues:
When changing the range, the chart lines are being rendered incorrectly.
The same exact chart looks different between the brush and the large chart. Is that because of the different heights?
Minimal reproduction of the problem with instructions
https://stackblitz.com/edit/react-reaviz
(The codesandbox link is not working)
Environment
The text was updated successfully, but these errors were encountered: