Replies: 3 comments 7 replies
-
|
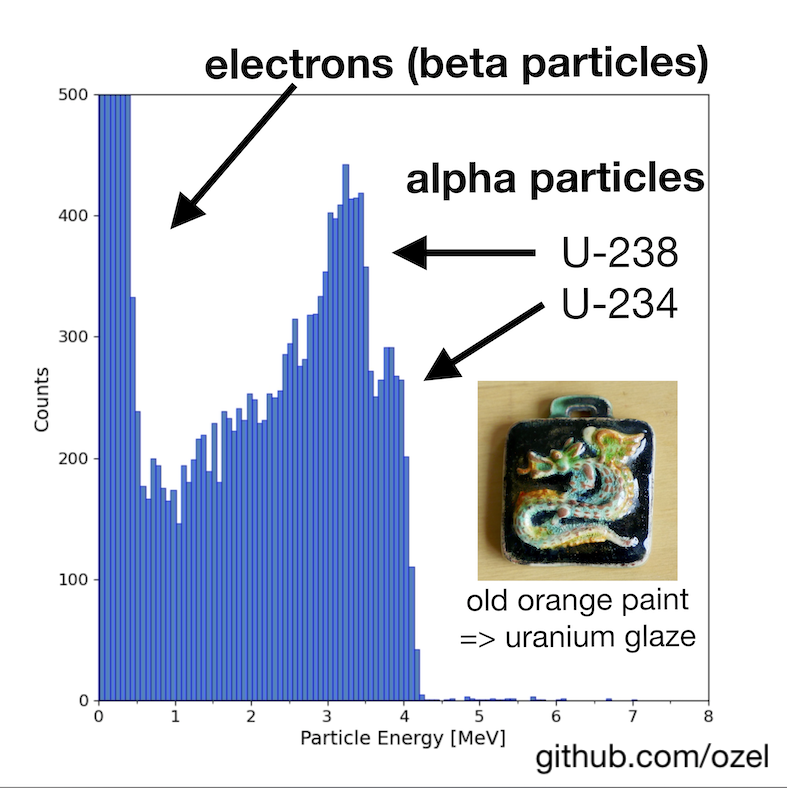
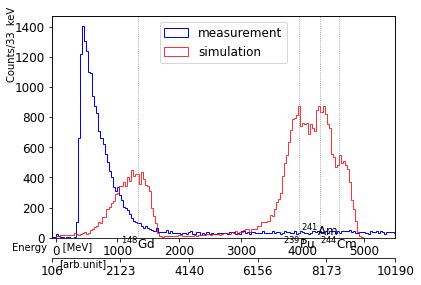
Nice progress, this measurement doesn't look so unexpected actually! You are using now the CM108 USB soundcard, right? If you have it at 100% and with gain boost enabled as explained in the Wiki, the coarse threshold for alphas is around -1250 ~= 500 keV (or about -8 mV on a regular oscilloscope input) I would advise you to use the code snipped labelled FULL ENERGY RANGE histogram instead of the reference measurement plot that you used. My reference alpha source, by the way, was an almost exclusive alpha emitter, besides few low-energy X-rays. The simulation software did not even simulate those, that's why the simulation is flatter in the very low energy regime than my reference measurement in figure 4. |
Beta Was this translation helpful? Give feedback.
-
|
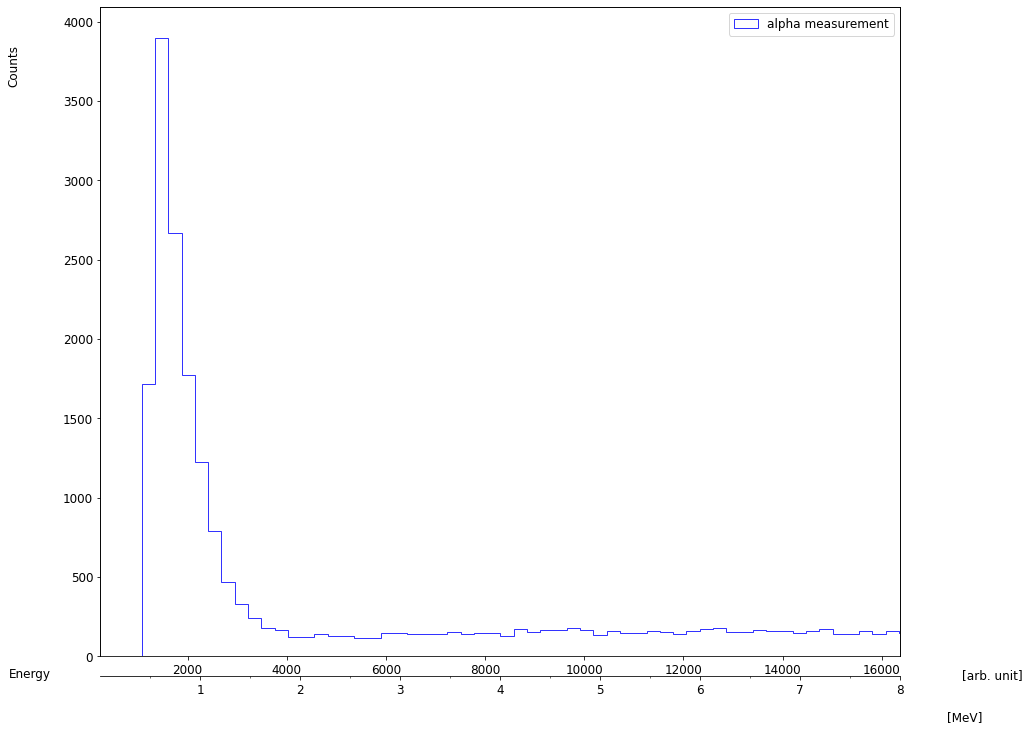
Hi Oliver The soundcard I'm using is the Sabrent AU-MMSA. This is also a very low-cost sound card (I paid around £5). I don't know if it is the same chipset as the one that you've used but I think it is highly likely that it is given my experience with low-cost manufacturers. It's plugged directly into a USB port on my Raspberry Pi4. My alpha source is a shard of red Fiestaware pottery and I'm placing it directly on top of the photodiode casing with the glazed side facing directly to the chip. The shard is small and the box (...when the lid is on!...) is well earthed via the shielded BNC cable. I had THL set to -1000 during this collection run and same in the analysis run as I was hitting memory limits on the Pi4 with >100,000 pulses. I used this value so as to ignore most of the electron pulses. I will reprocess the data but won't get a chance until Sunday as I have my first university exam in 40 years tomorrow! Steve |
Beta Was this translation helpful? Give feedback.
-
|
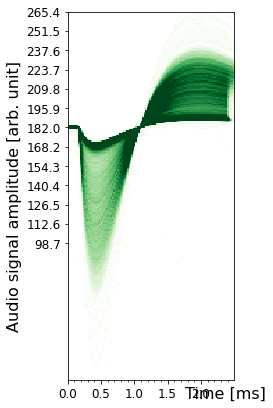
What are the hex numbers next to the Unitek device name in lsusb? Mine shows: Your pulse overlay looks excellent, congratulations! Only few pile-up "ghosts" on the right side (difficult to see in the compressed image, but single faint pulses can be seen to the right). I will explain why it looks so different from my ceramics plot above in the next post, once you showed the full x-range. :-) |
Beta Was this translation helpful? Give feedback.


-
My son and I have built our alpha spectrometer and it works first time, with lots of nice pulses and a good detection rate. Source is a shard of Fiestaware pottery with a uranium glaze. I did a recording run with about 40,000 detected alpha pulses but the spectrum I get looks very different to what I expect. I wasn't expecting to get anything like the simulation plots, but neither was I expecting to see a peak at the low energy end of the range - was expecting abroad peak around 4Mev(-ish). I've checked obvious things like recording level on my sound card. Does anyone have any ideas why I'm seeing what I'm seeing?

(Data file available but it's 318MB)
Beta Was this translation helpful? Give feedback.
All reactions