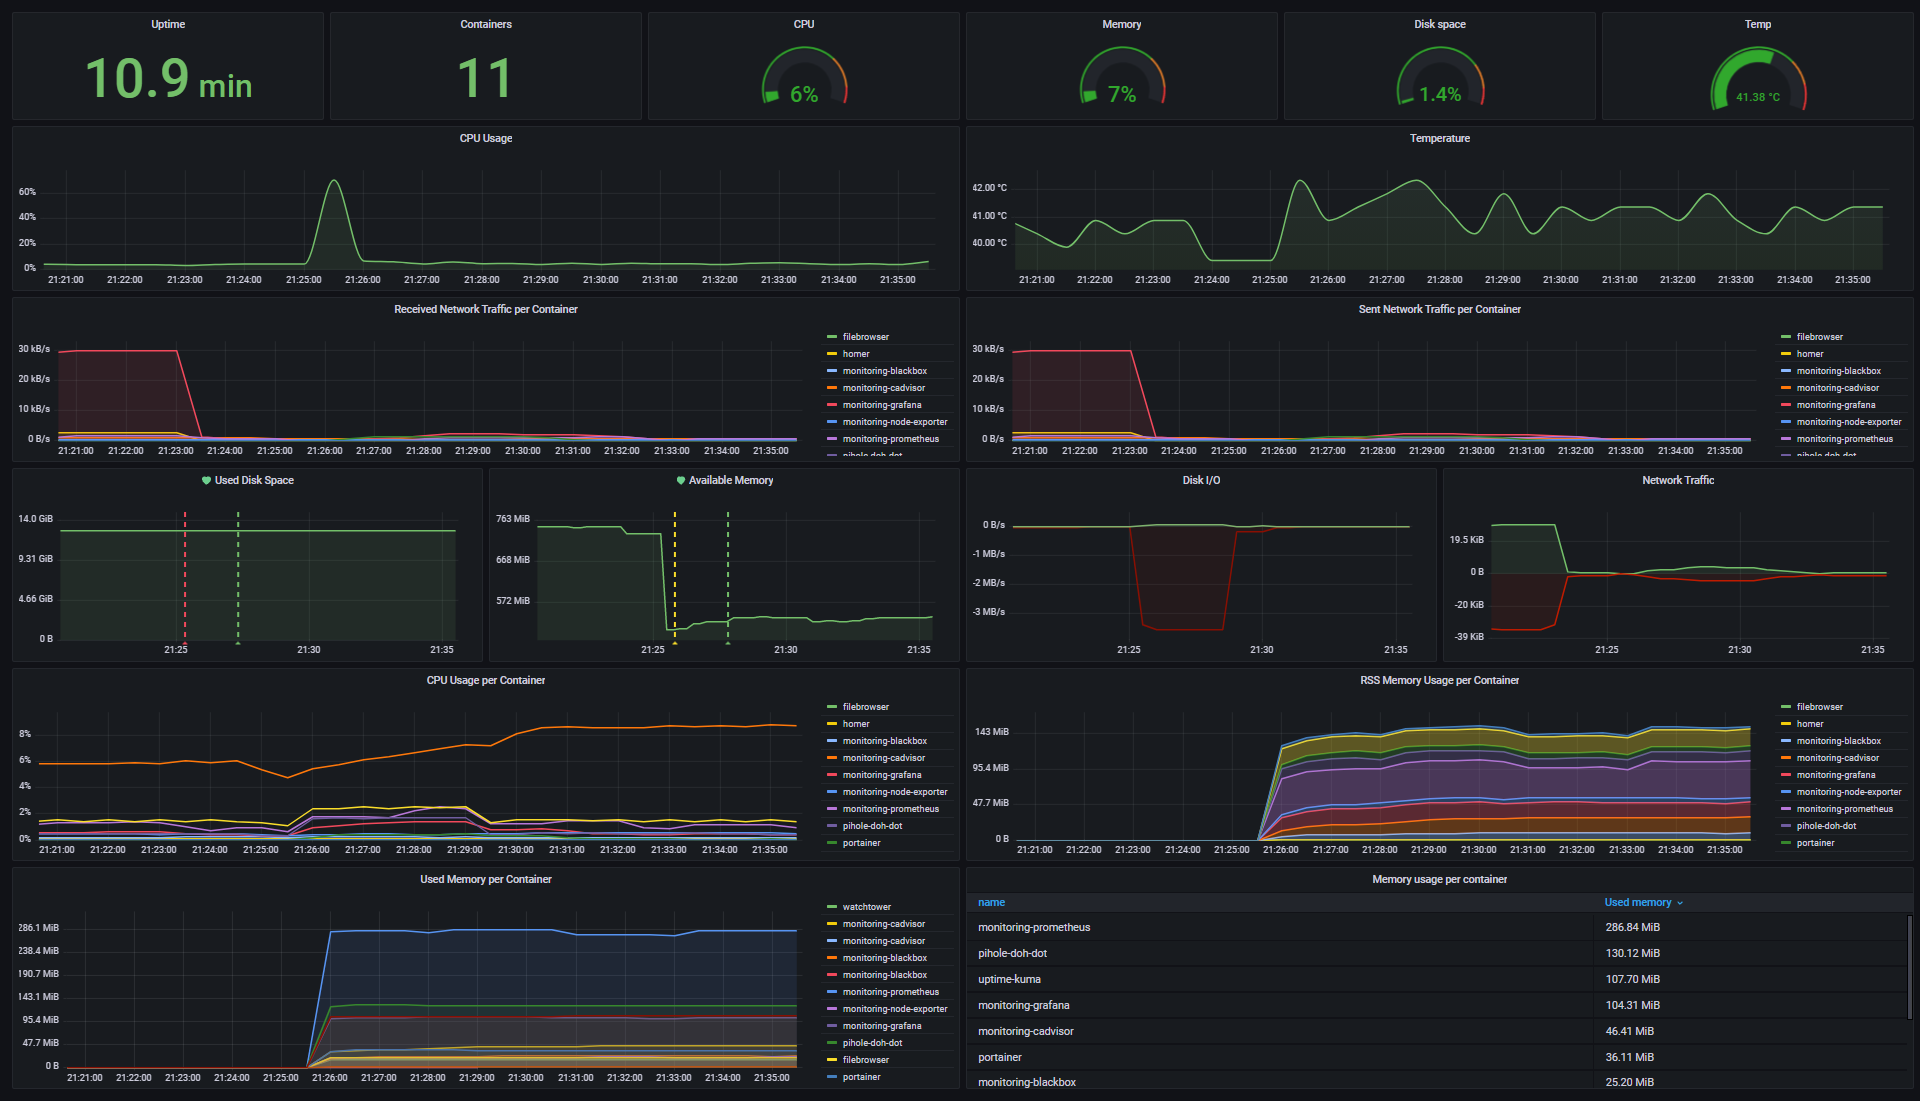
A monitoring solution for Docker hosts and containers with Prometheus, Grafana, cAdvisor, NodeExporter.
First SSH into your Pi and there is one thing we need to do before we get cracking. We need to enable c-groups so the stack will work out of the box. To do this you need to modify the configuration file cmdline.txt: This is stored in various locations depending on your OS. Some OS like PI OS Bullseye and Diet PI are setup to use cgroup ver 2 these change break several of the monitors so we need to disable that as well.
sudo nano /boot/cmdline.txt
sudo nano /boot/firmware/cmdline.txt
All c-group version 2 OS's Currently DietPI and PI OS Bullseye add the following options to the begin of the line:
systemd.unified_cgroup_hierarchy=0 cgroup_enable=memory cgroup_memory=1
cgroup_enable=memory cgroup_memory=1
sudo reboot
cat /proc/cgroups
You should see output something like this.
#subsys_name    hierarchy       num_cgroups     enabled
cpuset  9       15      1
cpu     7       69      1
cpuacct 7       69      1
blkio   8       69      1
memory  11      158     1
devices 3       69      1
freezer 5       16      1
net_cls 2       15      1
perf_event      6       15      1
net_prio        2       15      1
pids    4       76      1
rdma    10      1       1
The numbers aren't really important what is important is that you see memory in the list if you don't confirm you have put it in the correct file. Don't go on until you get this working.
First thing we need to do is setup the folder structure and install some files that need to be in place for everything to work correctly.
Run the following script
wget -qO- https://git.io/JPXba | sudo bash
Your output should look something like this
# wget -qO- https://git.io/JPXba | sudo bash
creating directories
downloading prometheus config files
--2021-10-17 00:56:28--  https://raw.githubusercontent.com/oijkn/Docker-Raspberry-PI-Monitoring/main/prometheus/prometheus.yml
Resolving raw.githubusercontent.com (raw.githubusercontent.com)... 185.199.110.133, 185.199.109.133, 185.199.111.133, ...
Connecting to raw.githubusercontent.com (raw.githubusercontent.com)|185.199.110.133|:443... connected.
HTTP request sent, awaiting response... 200 OK
Length: 163 [text/plain]
Saving to: ‘/portainer/Files/AppData/Config/prometheus/config/prometheus.yml’

/portainer/Files/AppData/Config/prometheus/config/promethe 100%[=======================================================================================================================================>]     163  --.-KB/s    in 0s

2021-10-17 00:56:28 (971 KB/s) - ‘/portainer/Files/AppData/Config/prometheus/config/prometheus.yml’ saved [163/163]

setting permissions
Done You are ready to goto next step in the install document
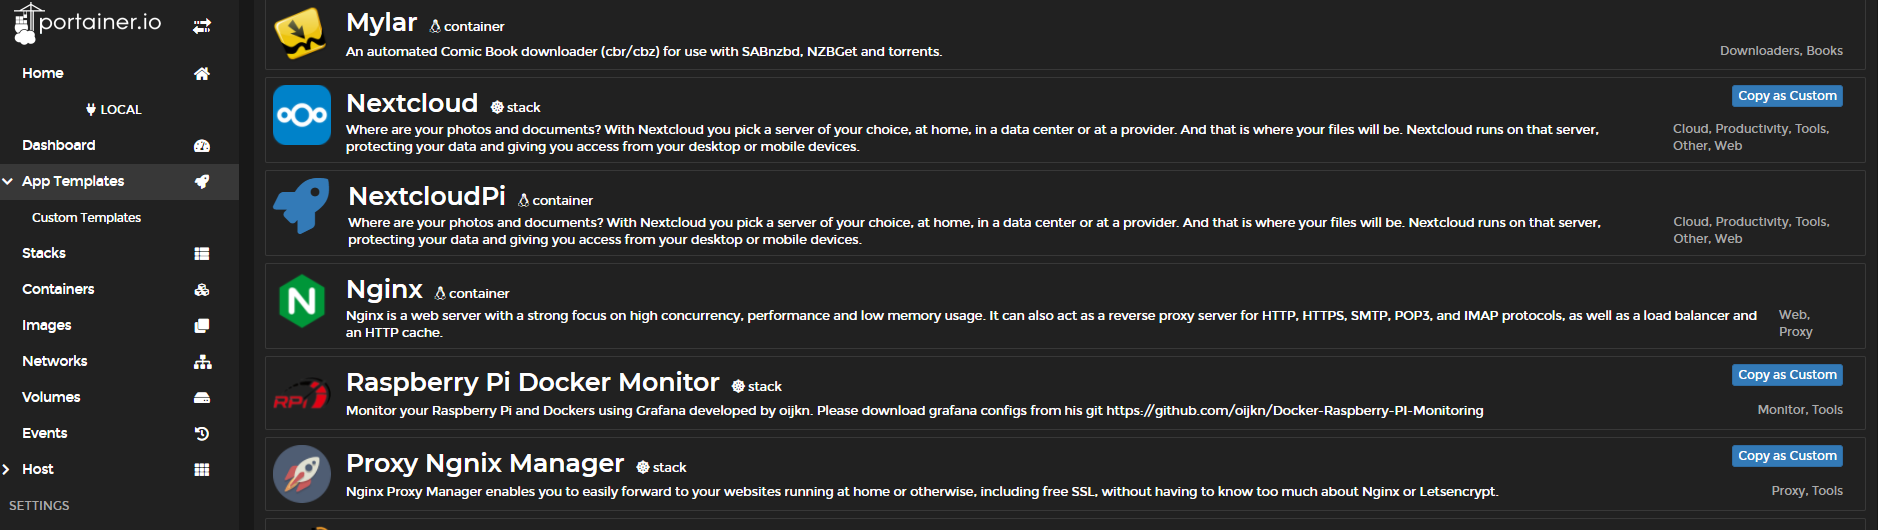
Goto App Templates and install "Raspberry Pi Docker Monitor"
You can change how long your data should be stored or leave the default 15d. It can be set with {ms,s,m,h,d,w,y} or a combination of it (e.g. 2w3d for 2 weeks and 3 days).
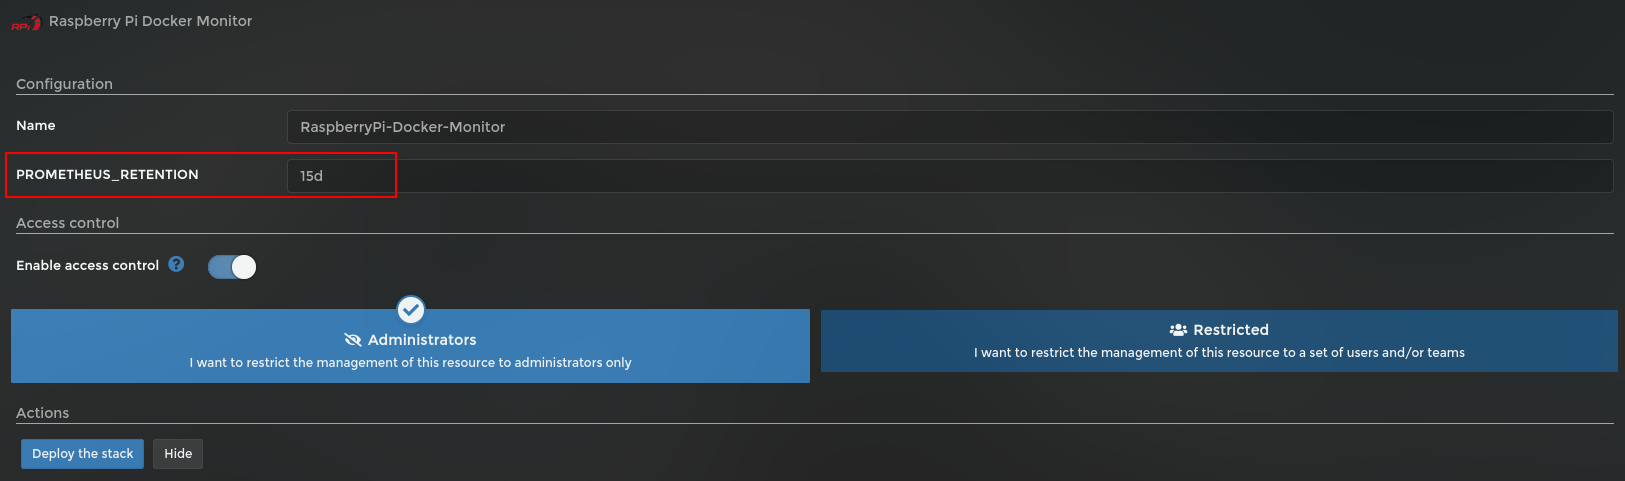
The default settings should all be good so Deploy the Stack
Navigate to Grafana http://<host-ip>:3000 and login with user admin password admin. You can change the credentials in the template file or by supplying the ADMIN_USER and ADMIN_PASSWORD environment variables inside the container monitoring-prometheus.
GF_SECURITY_ADMIN_USER=admin
GF_SECURITY_ADMIN_PASSWORD=changeme
GF_USERS_ALLOW_SIGN_UP=falseUser: Admin
Password: Admin
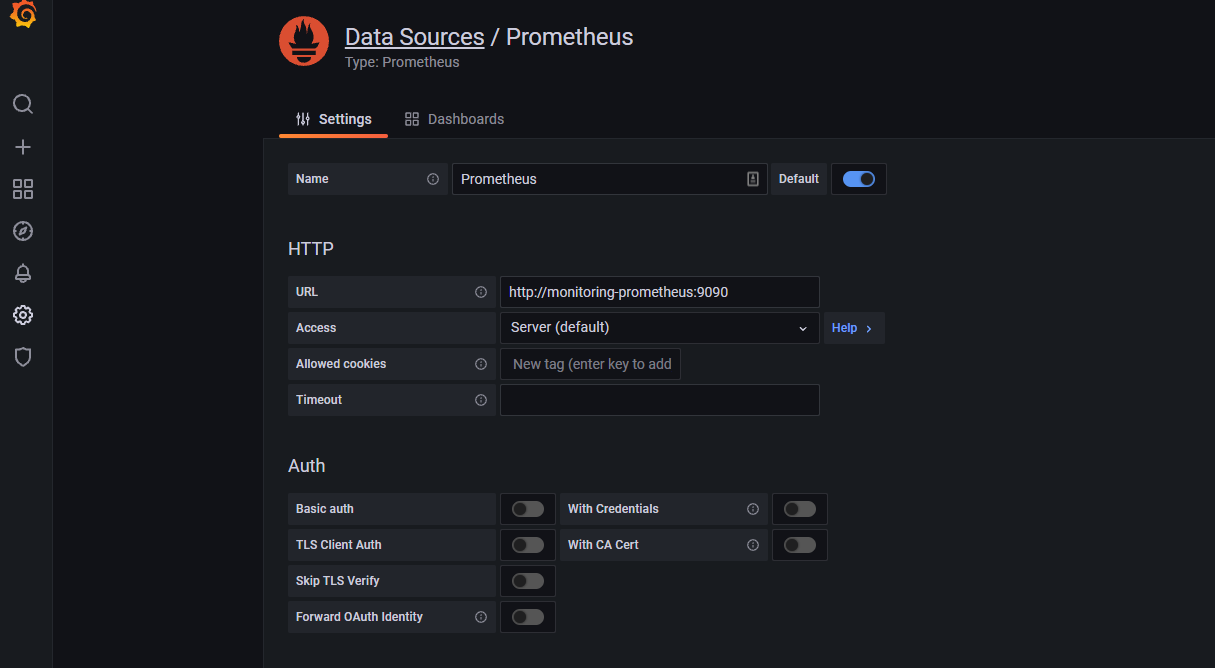
Grafana > Configuration > Data Sources > Prometheus
It is important that you set the URL to http://monitoring-prometheus:9090/
Grafana is not preconfigured with dashboard, so you have to import it from the Arm json or PC(AMD) json file.
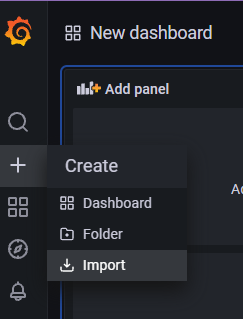
Grafana > + > Import
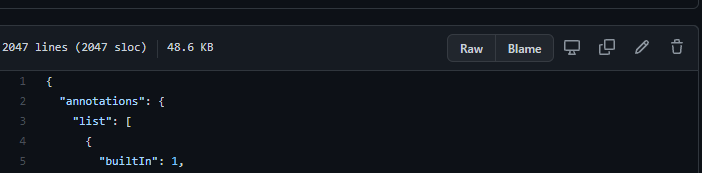
Now we open the Arm json or PC(AMD) json file and Click on the "raw" button to copy the content from the json file.
( )
)
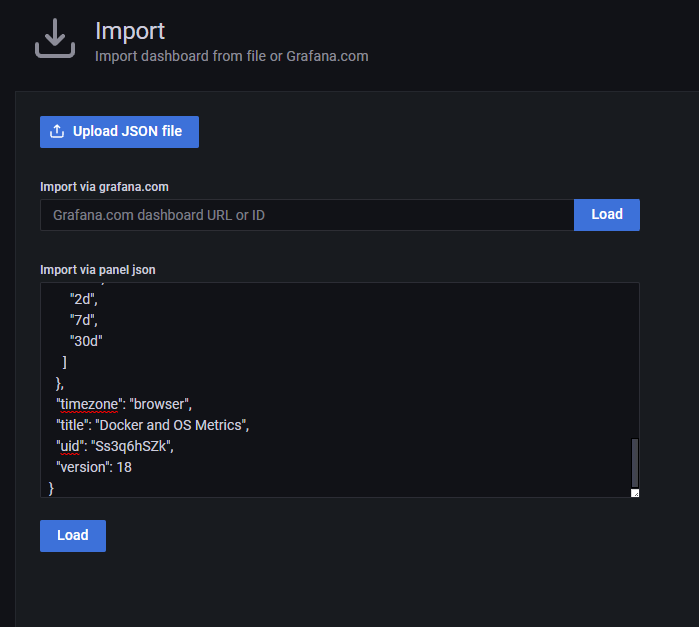
Once copied into the bigger of the 2 boxes Click Load.
Now we can display the dashboard
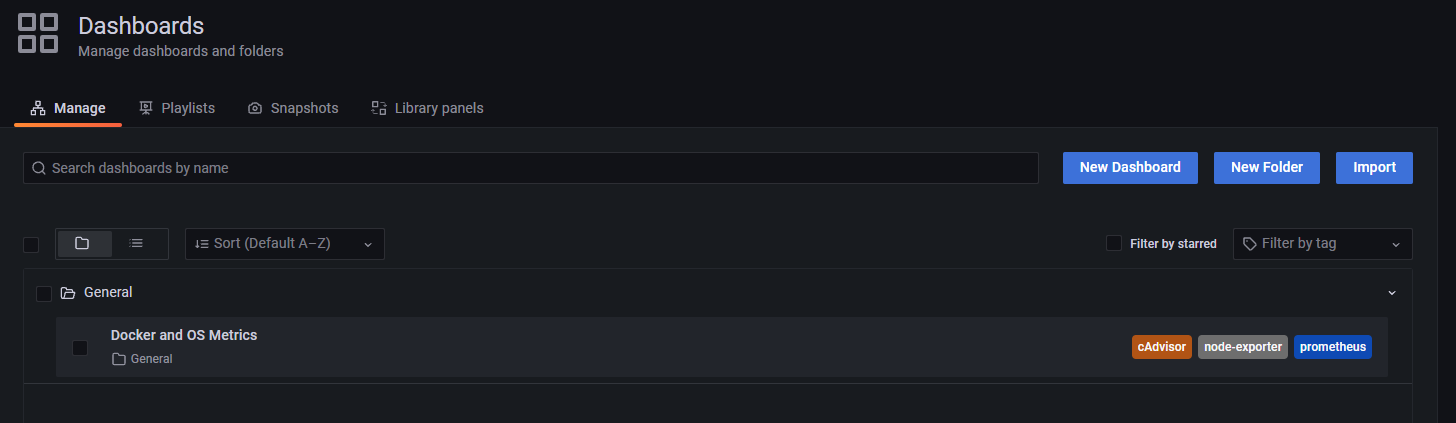
Grafana > Dashboard > Manage
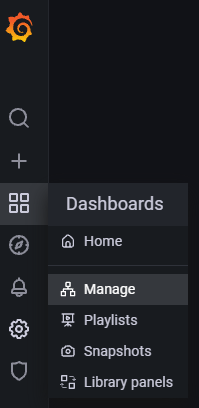
There should be just the one item list. Select "Docker and OS Metrics" from the list and you should see the dashboard listed below.
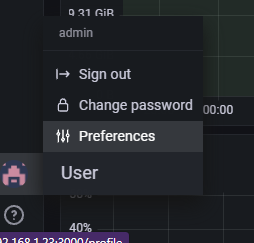
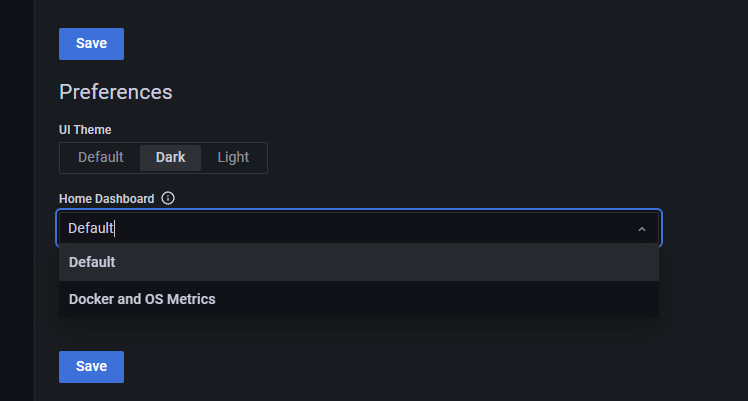
Hint: Well the Dashboard is displayed you can select your profile > Preferences and change the default Dashboard to the new Dashboard you just create and it will always display the new Dashboad when you login.

- based on Docker-Raspberry-PI-Monitoring by Oijkn