Mulesoft connector that allows a service to participate or initiate a transaction with the standard library Open Telemetry
Table of content
- Introduction
- Architecture
- Configuration
- Using the connector
- Debugging the connector
- Available tags in traces
- Compile
OpenTelemetry is an open-source framework for collecting and processing telemetry data that is used by many companies and organizations to monitor and troubleshoot their applications in production. It provides a standard way to instrument applications, send telemetry data to a backend, and analyze it.
One of the key features of OpenTelemetry is its ability to trace the flow of a request through a distributed system. This is accomplished through the use of spans, which are units of work that are traced within a trace. Each span represents a single operation within the trace and can be used to represent a database query, a network request, or any other action that happens within the trace.
Spans are used to build a tree-like structure called a trace, which represents the flow of a request as it travels through a distributed system. Each span in the trace has a unique identifier and is associated with information about the operation it represents, such as the name of the operation, the start and end time, and any metadata or tags associated with the span.
In addition to tracing, OpenTelemetry also provides support for collecting metrics and logs. This allows you to get a comprehensive view of the performance and behavior of your application, which can be useful for identifying issues and optimizing performance.
One of the benefits of using OpenTelemetry is that it is vendor-neutral and easily integrates with a wide range of systems and tools. This means that you can use it with your choice's backend and analysis tools and switch between different ones without having to re-instrument your application.
Overall, OpenTelemetry is a valuable tool for anyone looking to monitor and troubleshoot their applications in production. It provides a standard way to collect and process telemetry data, and its support for tracing, metrics, and logs makes it a powerful tool for understanding the performance and behavior of your application.
This project uses the OpenTelemetry Java SDK https://github.com/open-telemetry/opentelemetry-java. The connector follows a minimalistic approach that helps to implement the following architecture.

The connector will send the telemetry data using the otlp protocol to an open telemetry collector that is responsible for collecting all inputs from the services, processing them, and exporting the data to an observability backend like Jaeger.
The connector embraces the configuration through the environment variables described in the OpenTelemetry SDK Auto-configure:
- https://github.com/open-telemetry/opentelemetry-java/blob/main/sdk-extensions/autoconfigure/
- https://opentelemetry.io/docs/reference/specification/sdk-environment-variables/
- https://github.com/open-telemetry/opentelemetry-specification/blob/main/specification/protocol/exporter.md
The basic parametrization can be done through the component configuration window:

| Parameter | Description |
|---|---|
| Service name | The name of the service that is used to name the main trace. Example: salesforce-customer-sapi. This value is connected with the environment variable: OTEL_SERVICE_NAME, described in the SDK documentation |
| Additional tags | Specify resource attributes in the following format: key1=val1,key2=val2,key3=val3. Example: layer=sapi, environment:local. This value is connected with the environment variable: OTEL_RESOURCE_ATTRIBUTES |
| Collector endpoint | The OTLP traces endpoint to connect to. The default is http://localhost:4317 when the protocol is GRPC and http://localhost:4318/v1/traces when the protocol is HTTP/PROTOBUF. The value is connected with the environment variable: OTEL_EXPORTER_OTLP_TRACES_ENDPOINT |
Configuration example of the connector in the mule configuration file global.xml:
<open-telemetry:config
	name="Open_Telemetry_Connector_Config"
	doc:name="Open Telemetry Connector Config"
	doc:id="5c85f8ab-75c8-45b2-b93d-311337bc24bf"
	serviceName="${deployment.name}"
	additionalTags="environment=${env}, layer=papi"
	collectorEndpoint="${otel.collectorendpoint}"
	doc:description="Using the standard configuration. Overriding the collector endpoint.">
</open-telemetry:config>By default, the connector will send the traces to localhost:4317. Jaeger server can be configured to collect traces using all-in-one mode. Documentation: https://www.jaegertracing.io/docs/1.38/getting-started/. Example:
./jaeger-all-in-one --collector.otlp.enabled=trueUsing the default configuration values for the connector, start the mule engine with the next property
-M-Dotel.traces.exporter=loggingThe connector will generate a new span for every flow in the service, so if it is required to measure the performance of a group of components, they should be grouped in a flow. The HTTP connector has the ability to propagate context to remote services using the W3C Trace Context HTTP headers. In the example below, the header traceparent is sent to the remote service:

The connector will provide the global variable: openTelemetryTrace.traceparent, which can be used to propagate the trace.
In the next example, Get Orders (number 2) and Get Customers (number 1) calls will propagate trace data to the child services.
 Mule flow example
The complete trace data in the Observability Backend (Jaeger)
 Traces example in Jaeger
The spans can be enriched with custom tags. These tags can hold the values of environment variables like container name, cloud region, instance number, etc. These tags are configured in the connector configuration window. Also, we have runtime tags set at flow level that can hold business data like product number, client name, order date, etc. To set the tags, a global variable is provided: openTelemetryTags
Example, business flow:
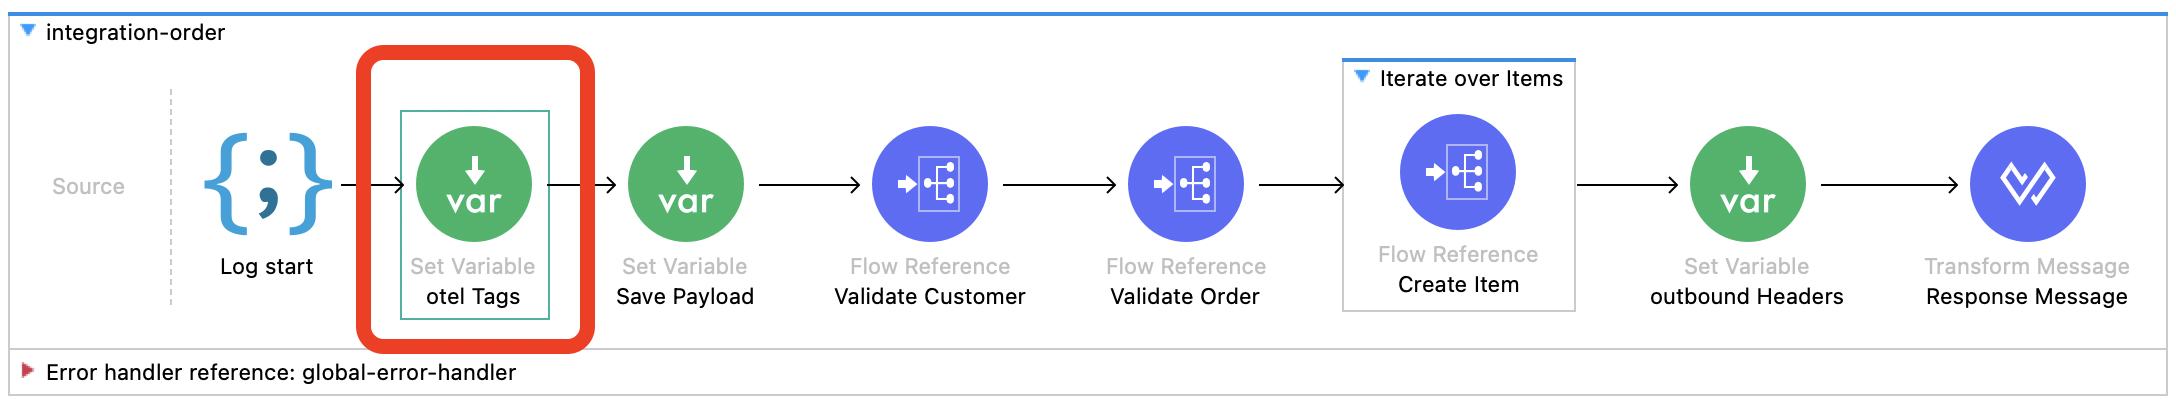
Code for “Set Variable” operation and variable: openTelemetryTags
%dw 2.0
output application/java
---
{
  "poNumber": payload.orderData.poNumber default "",
  "firstName": payload.customer.firstName default ""
}
In the observability backend, the tags can be queried, and the results will shown the matches:
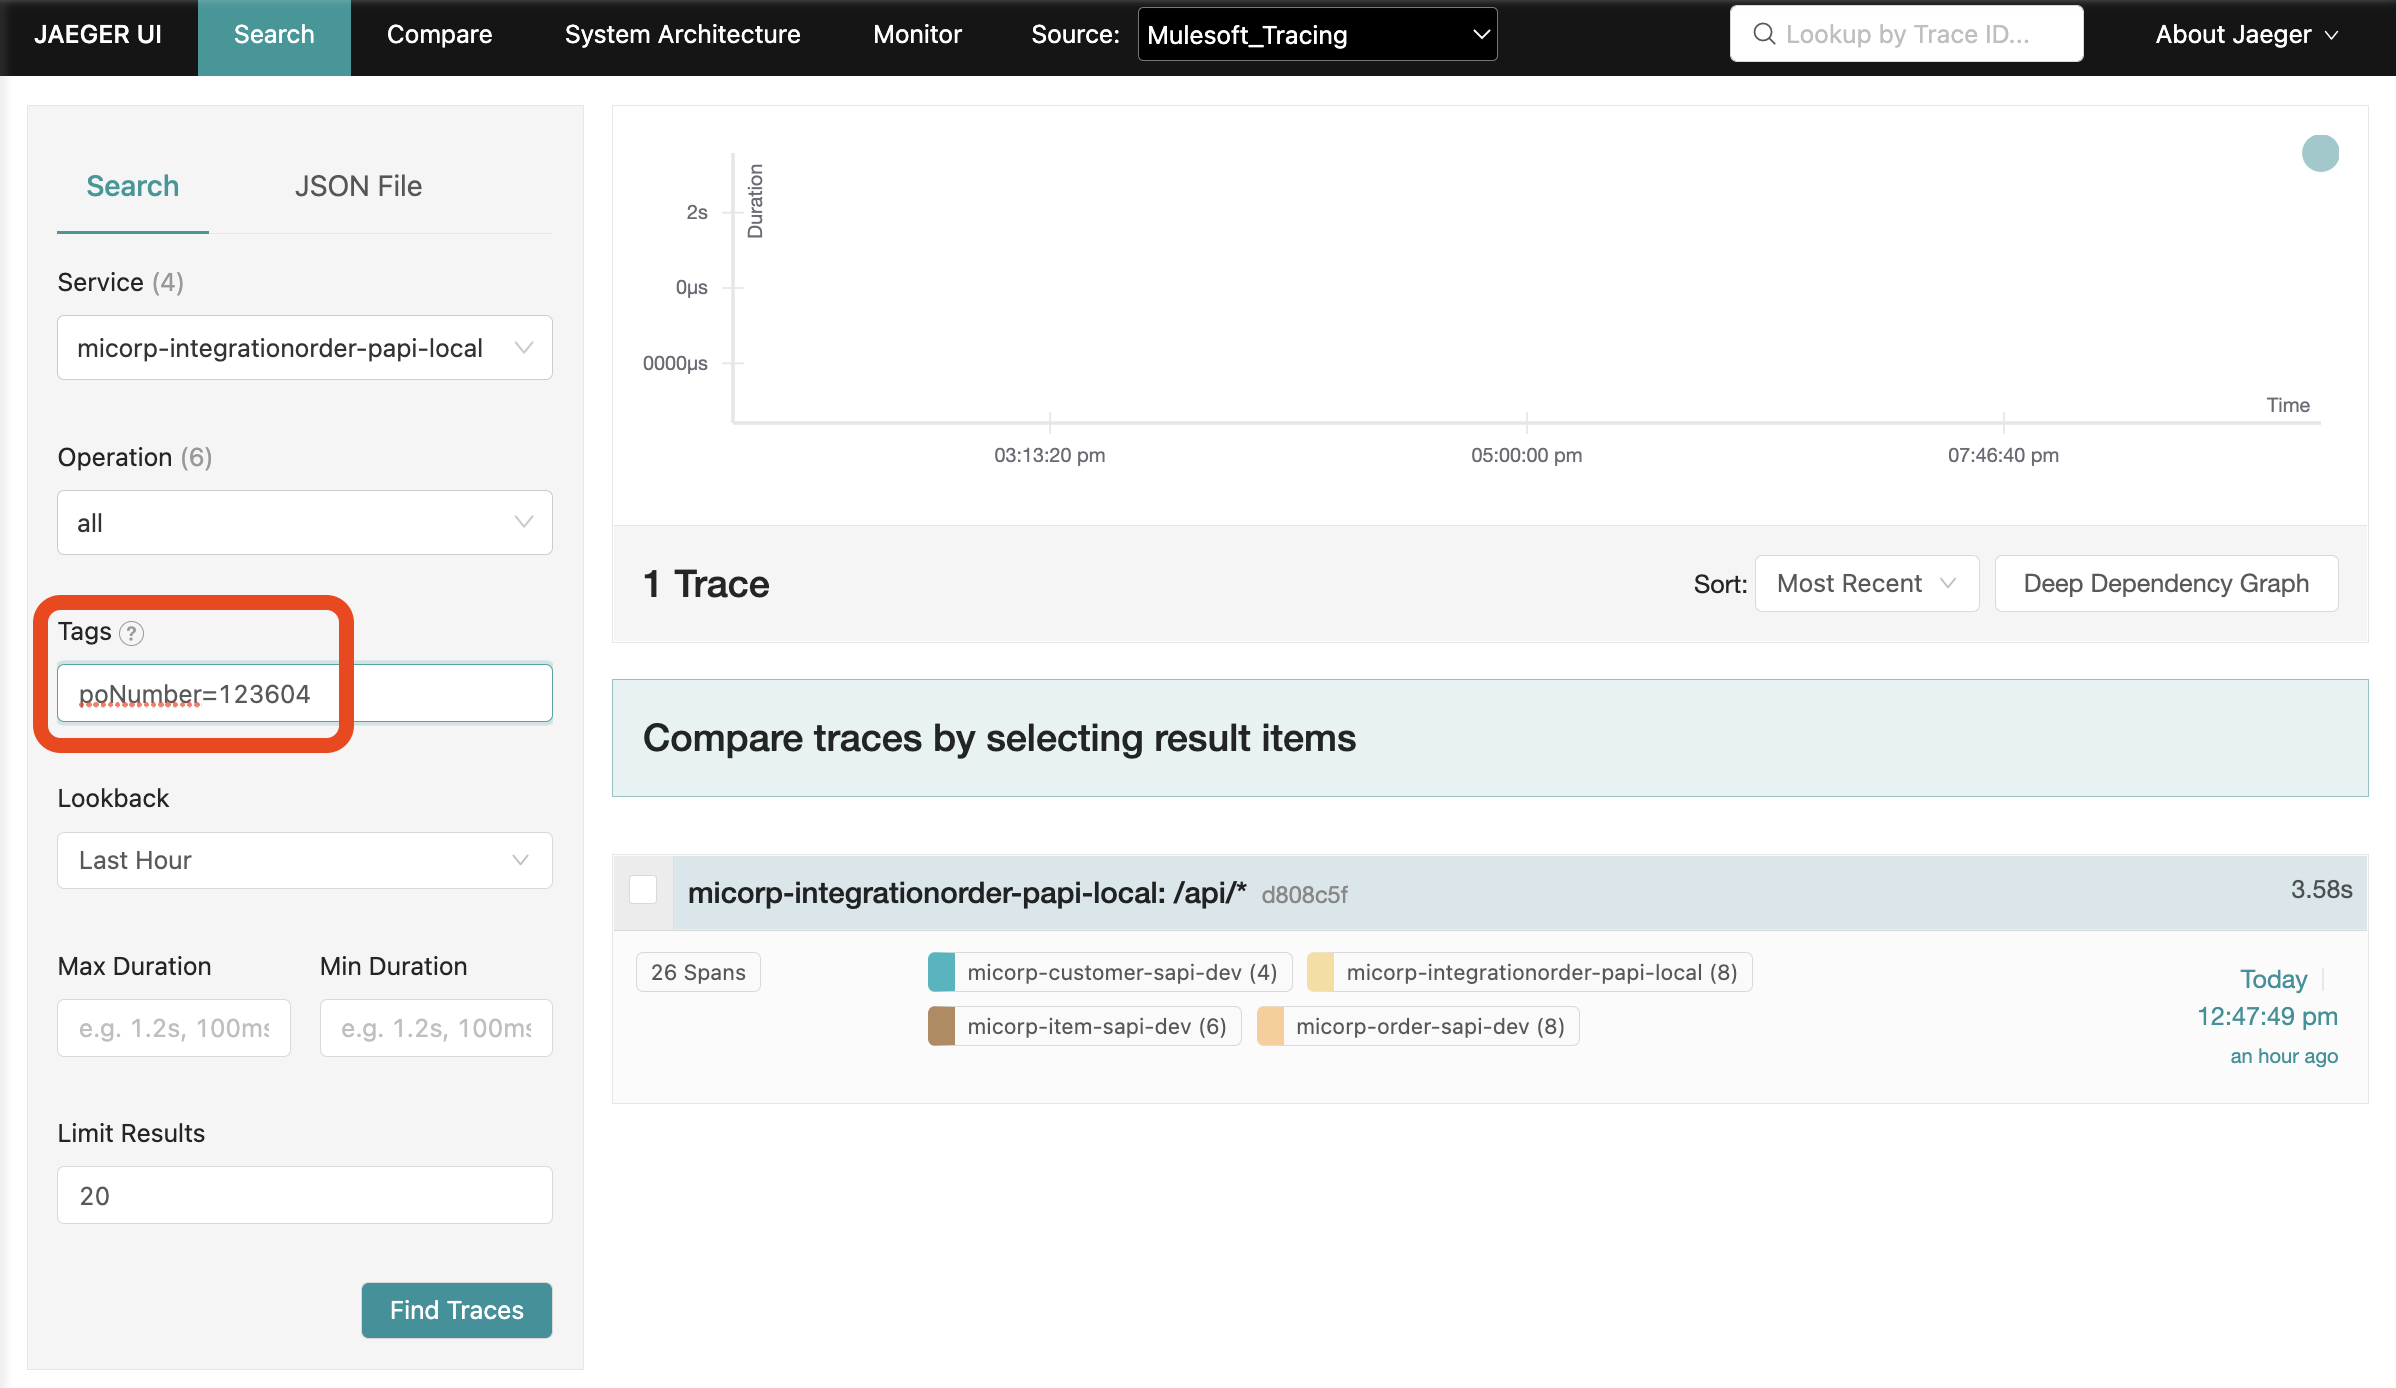
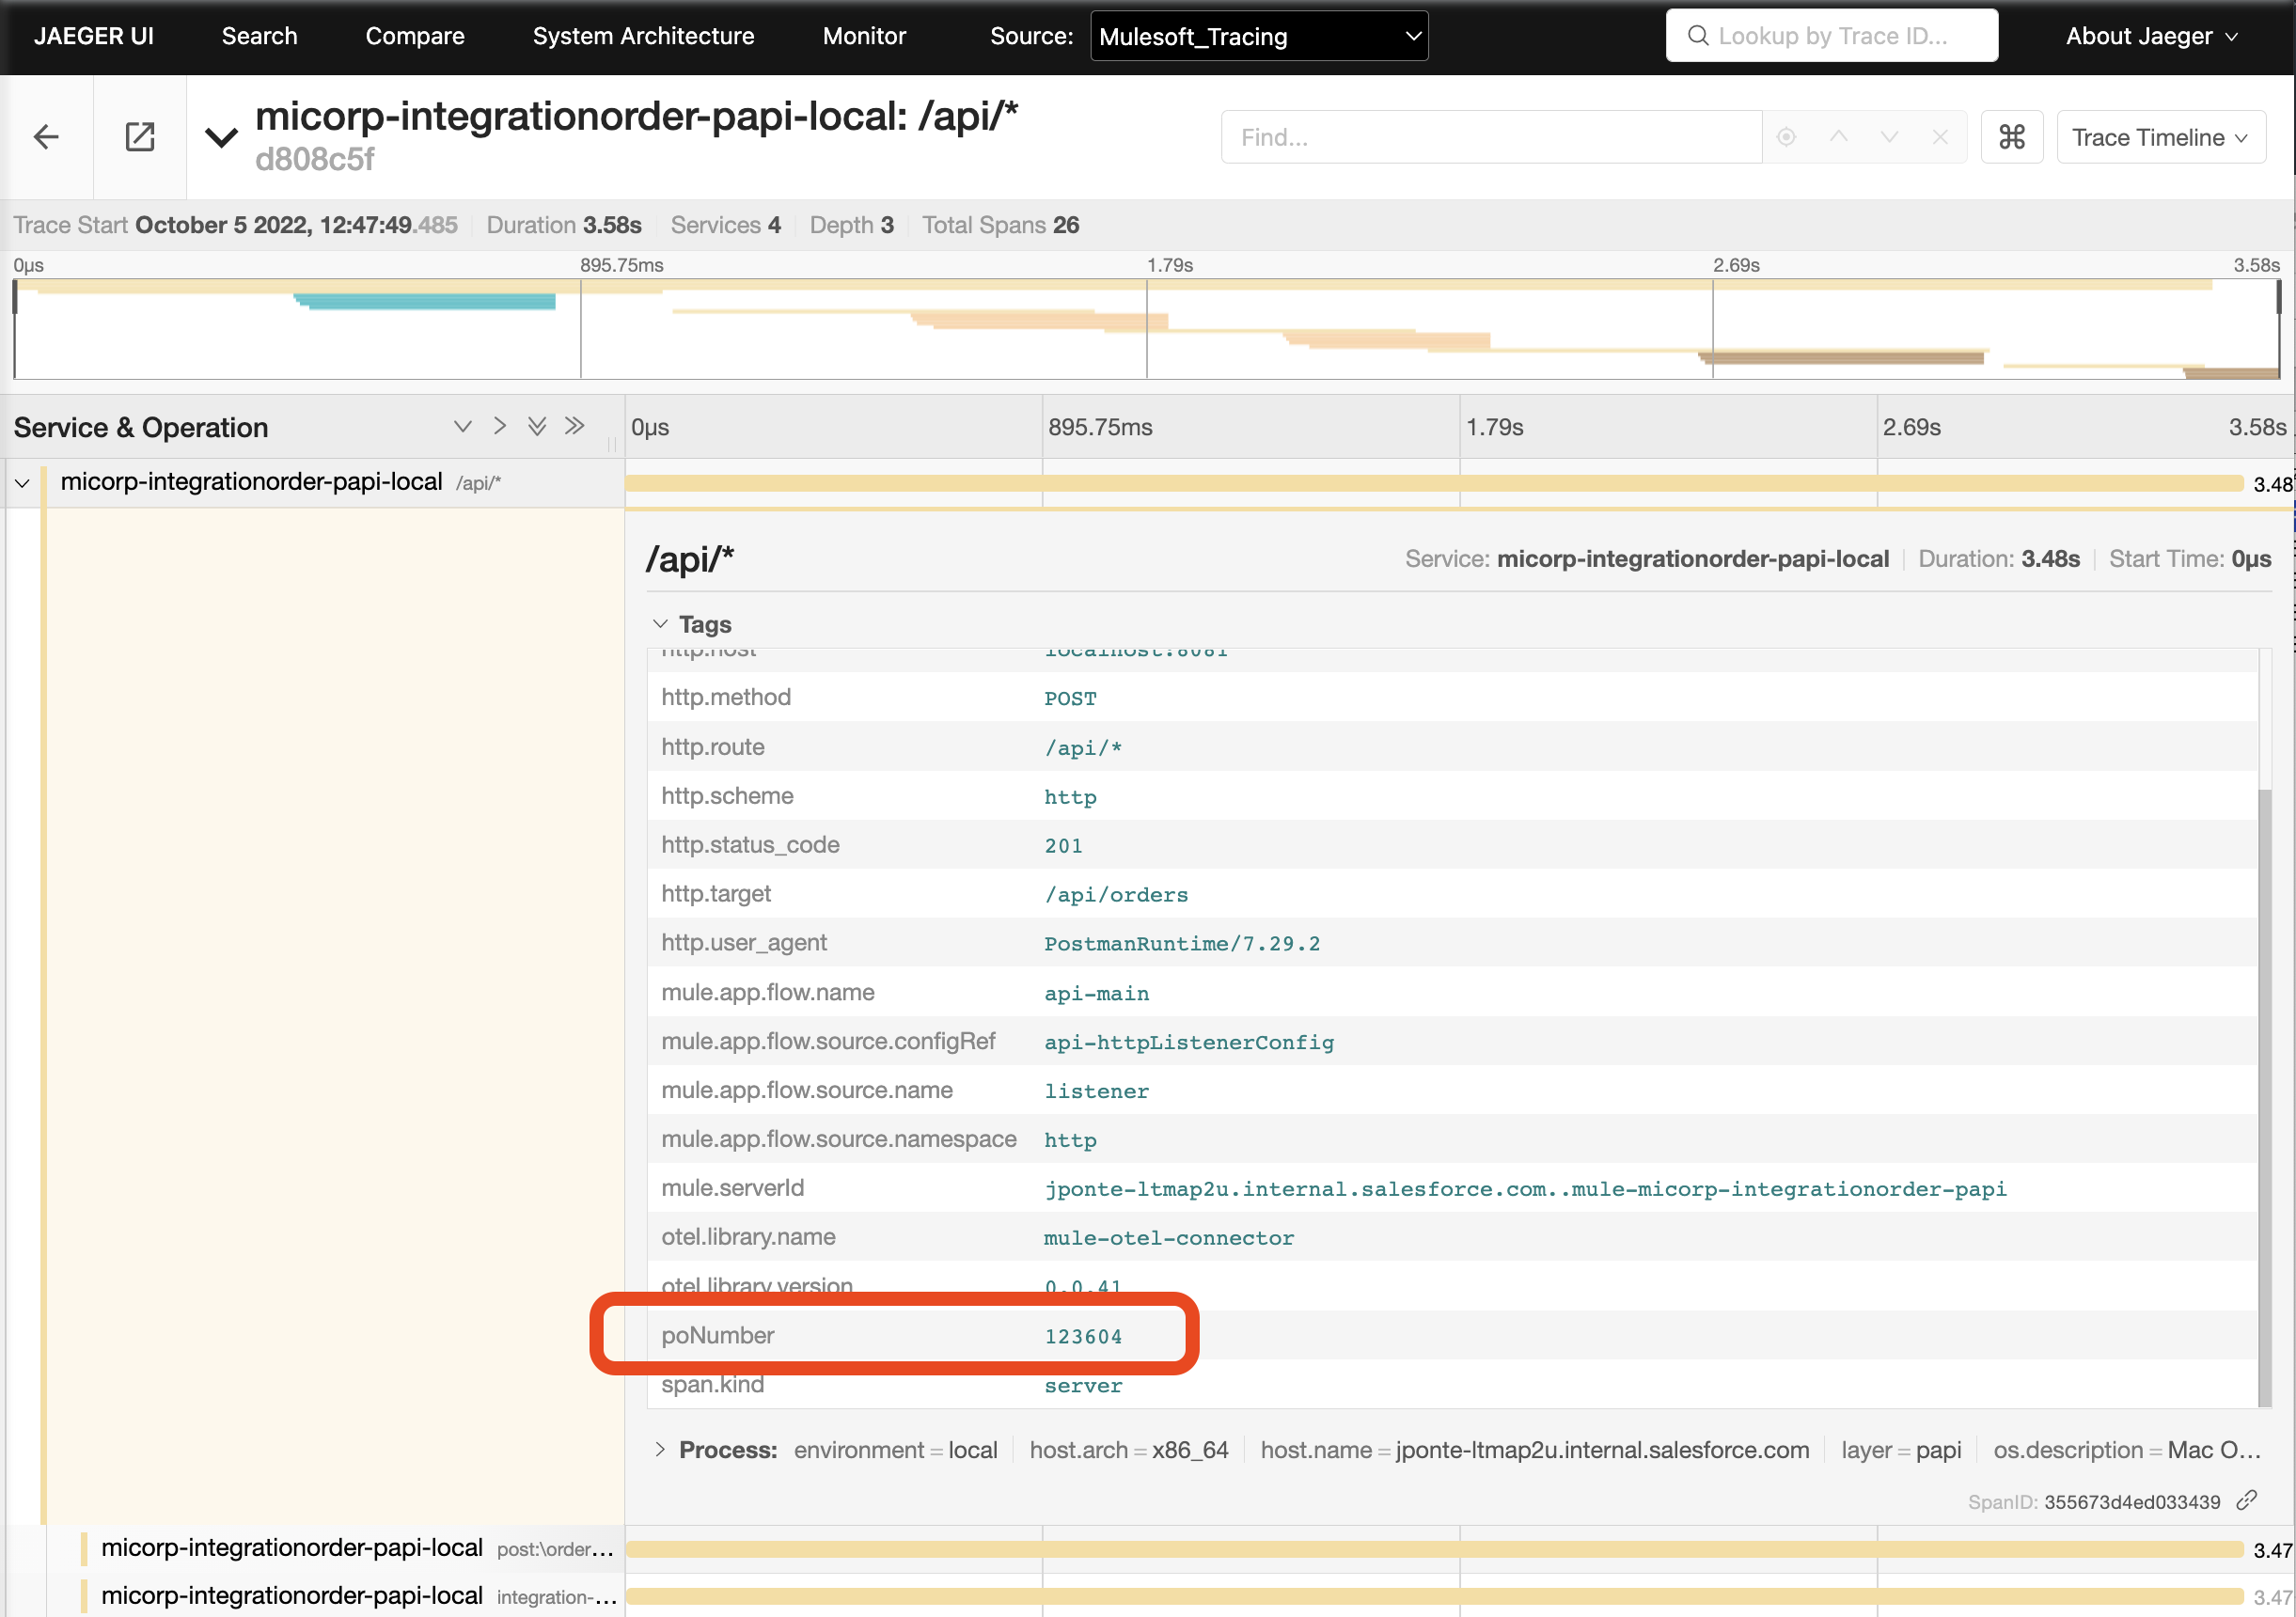
The next image shows the queried tag along with others that are part of the span:
By default, the connector uses the standard variable httpStatus to get the response from the service, for example:

Setting the httpStatus variable example
To show the connector logs with debug level, add the next logger to log4j2.xml:
<AsyncLogger name="com.mulesoft.ot" level="DEBUG"/>Next is the list of the available tags included in the tracing.
A host is defined as a general computing instance.
| Attribute | Description |
|---|---|
| host.arch | The CPU architecture the host system is running on. |
| host.name | Name of the host. On Unix systems, it may contain what the hostname command returns, or the fully qualified hostname, or another name specified by the user. |
An operating system process
| Attribute | Description |
|---|---|
| process.command_line | The full command used to launch the process as a single string representing the full command. On Windows, can be set to the result of GetCommandLineW. Do not set this if you have to assemble it just for monitoring; use process.command_args instead. |
| process.executable.path | The full path to the process executable. On Linux based systems, can be set to the target of proc/[pid]/exe. On Windows, can be set to the result of GetProcessImageFileNameW. |
| process.pid | Process identifier (PID). |
| process.runtime.name | The name of the runtime of this process. For compiled native binaries, this SHOULD be the name of the compiler. |
| process.runtime.version | The version of the runtime of this process, as returned by the runtime without modification. |
| process.runtime.description | An additional description about the runtime of the process, for example a specific vendor customization of the runtime environment. |
The operating system (OS) on which the process represented by this resource is running. In case of virtualized environments, this is the operating system as it is observed by the process, i.e., the virtualized guest rather than the underlying host.
| Attribute | Description |
|---|---|
| os.description | Human readable (not intended to be parsed) OS version information, like e.g. reported by ver or lsb_release -a commands. |
| os.type | The operating system type. |
The telemetry SDK used to capture data recorded by the instrumentation libraries.
| Attribute | Description |
|---|---|
| telemetry.sdk.name | The name of the telemetry SDK as defined above. |
| telemetry.sdk.language | The language of the telemetry SDK. |
| telemetry.sdk.version | The version string of the telemetry SDK. |
The HTTP request, response, and headers tags
| Attribute | Description |
|---|---|
| http.flavor | Kind of HTTP protocol used |
| http.host | Logical local hostname or similar, see note below |
| http.method | HTTP request method |
| http.route | The matched route (path template in the format used by the respective server framework) |
| http.scheme | The URI scheme identifying the used protocol. |
| http.status_code | HTTP response status code |
| http.target | The full request target as passed in a HTTP request line or equivalent |
| http.user_agent | Value of the HTTP User-Agent header sent by the client. https://www.rfc-editor.org/rfc/rfc9110.html#field.user-agent |
| http.request_content_length | The size of the request payload body in bytes |
| http.content_type | Format type of the request payload |
Java Semantic Definition: https://github.com/open-telemetry/opentelemetry-java/blob/main/semconv/src/main/java/io/opentelemetry/semconv/trace/attributes/SemanticAttributes.java
Example:

Http tags example
MULE service metadata
| Attribute | Description | Runtime value |
|---|---|---|
| mule.serverId | Server Id | EnrichedServerNotification.getServerId() |
| mule.service.flow.name | The resourceIdentifier is used when firing inbound server notifications such as Admin notifications or other action notifications triggered by an external source Used to associate the event with a particular resource. | EnrichedServerNotification.getResourceIdentifier() |
SOURCE. Metadata about the source component which originates the flow. The runtime value is taken from:
ComponentIdentifier sourceIdentifier = enrichedServerNotification
					.getEvent()
					.getContext()
					.getOriginatingLocation()
					.getComponentIdentifier()
					.getIdentifier();
Attributes
| Attribute | Description | Example |
|---|---|---|
| mule.service.flow.source.configRef | Configuration reference | HTTP_Listener_configuration |
| mule.service.flow.source.name | Name of the component | listener |
| mule.service.flow.source.namespace | Namespace | http |
In the next image the listener component is the source:

PROCESSOR. Metadata about the component that creates a new span. The runtime value is taken from:
org.mule.runtime.api.component.ComponentIdentifier =
			enrichedServerNotification.getComponent().getIdentifier().getName()
Attributes
| Attribute | Description | Runtime value |
|---|---|---|
| mule.service.processor.name | Connector name | request |
| mule.service.processor.namespace | Namespace | http |
| mule.service.processor.docname | XML attribute value for doc:name | errorWriter request |
| mule.service.processor.configRef | Configuration reference | HTTP_Request_configuration |
To compile and deploy the connector to your Anypoint Exchange run in your terminal:
mvn deployThe project includes a code format plugin: spotless-maven-plugin This plugin follows the eclipse format rules and the documentation can be found here. When the code has format errors, those can be fixed by running:
mvn spotless:applyIncrease the version number in pom.xml
<version>1.0.41</version>Update the version in constant LIBRARY_VERSION in java class: Constants.java. This value
public static final String LIBRARY_VERSION = "1.0.41";