Run the nginx container by:
docker pull nginx
docker run nginx
When you run this command, the following happens (assuming you are using the default DockerHub registry configuration):
- Docker pulls the
nginximage from DockerHub. - Docker creates a new container from the
nginximage. Thenginximage is a ready-to-run container image that encapsulates the NGINX web server software, along with its dependencies and configuration. When the image is used to create a container, it provides a fully functional NGINX server environment, without the need to install and configure nginx on your machine. - Docker allocates a dedicated read-write filesystem to the container (which is completely different and isolated from the host machine fs). This allows a running container to create or modify files and directories in its local filesystem.
- Docker creates a virtual network interface to connect the container to the network. This includes assigning an IP address to the container. By default, containers can connect to external networks using the host machine's network connection.
- Docker starts the container.
- When you type
CTRL+cthe container stops but is not removed. You can start it again or remove it. When a container is removed, its file system is deleted.
To see your running containers, type:
docker ps or add -a flag to list also stopped containers:
$ docker ps -a
CONTAINER ID   IMAGE     COMMAND                  CREATED              STATUS                      PORTS     NAMES
d841a2fe07f9   nginx     "/docker-entrypoint..."   About a minute ago   Exited (0) 14 seconds ago             funny_blackburn
In the above output:
d841a2fe07f9is the container ID - a unique identifier assigned to each running container in Docker./docker-entrypoint...is the (beginning) of the actual linux command that has run to initiate the process of the container.funny_blackburnis a random alphabetical name that docker assigned to the container.
Pull and run the container hello-world.
- What is the status of the container after some moments of running?
- Use
docker images hello-worldto get some information about the image from which the container has run. What is the image size? - What is the command used to launch the container
hello-world?
When the nginx image was built (we will build our own images soon), Docker allows us to specify a default command that defines what is executed when a container is started from the image.
However, you can override the default execution command by providing a new command as arguments when running the docker run command.
To override the default command, simply append the desired command to the end of the docker run command.
Let's say you want to run the same above nginx container, but you want to modify the default command so nginx is running in debug mode. You can override the default command by:
docker run nginx nginx-debug -g 'daemon off;'In the above example, the nginx container will be initiated using the command nginx-debug -g 'daemon off;'.
Here is another very useful example:
docker run -it nginx /bin/bashThe command starts a new Docker container and launches an interactive terminal session within the container.
Here's what each part of the command does:
docker runinstructs Docker to create and start a new container.-itis a combination of two flags:-ikeeps STDIN open for the container, and-tallocates a pseudo-TTY to allow interaction with the container's terminal.nginxrefers to the Nginx image./bin/bashspecifies the command to be executed within the container, in this case, launching a Bash shell.
When you run this command, a new container based on the Nginx image is created, and you are provided with an interactive, fresh and beloved bash terminal session inside the container.
This allows you to directly interact with the Nginx container's files, run commands, and perform operations within the isolated containerized environment.
Feel free to go wild, you are within a container :-)
In your open Nginx container terminal session:
- What is the current user?
- What is the hostname?
- Is the container connected to the internet? Can you ping
google.com? Oh, don't have thepingcommand? Install it inside the container! - What is the user's home directory?
- How many processes are running in the container? What could that indicate?
- Do you have
dockerinstalled in the container?
In addition to starting a new container with an interactive terminal session using docker run -it, you can also interact with running containers using the docker exec command.
The docker exec command allows you to execute a command inside a running container. Here's the basic syntax:
docker exec [OPTIONS] CONTAINER COMMAND [ARG...]Let's see it in action...
Start a new nginx container and keep it running. Give it a meaningful name instead the one Docker generates:
docker run --name my-nginx nginx Make sure the container is up and running. Since the running container occupying your current terminal session, open up another terminal session and execute:
$ docker ps
CONTAINER ID   IMAGE     COMMAND                  CREATED              STATUS              PORTS     NAMES
89cf04f27c04   nginx     "/docker-entrypoint.…"   About a minute ago   Up About a minute   80/tcp    my-nginx
Now say we want to debug the running nginx container, and perform some maintenance tasks, or executing specific commands within the containerized environment, we can achieve it by:
docker exec -it my-nginx /bin/bashAnd you're in... You can execute any command you want within the running my-nginx container.
Tip: if you don't know the container name, you can exec a command also using the container id:
docker exec -it 89cf04f27c04 /bin/bashHow many running processes does the container run? Hint: you can use the docker top command.
The first process is the nginx master process, and the rest are workers that should serve incoming requests to the webserver.
You are told that the nginx configuration file is located under /etc/nginx/nginx.conf.
Install nano in the container, and edit the nginx.conf as follows:
- worker_processes  auto;
+ worker_processes  1;
Save the file. Stop the container by: docker stop my-nginx and start again by: docker start my-nginx, was the number of workers changed?
The docker inspect command is used to retrieve detailed information about Docker objects such as containers, images, networks, and volumes. It provides a comprehensive JSON representation of the specified object, including its configuration, network settings, mounted volumes, and more.
The basic syntax for the docker inspect command is:
docker inspect [OPTIONS] OBJECTWhere OBJECT represents the name or ID of the Docker object you want to inspect.
Inspect your running container by:
$ docker inspect my-nginx
....When running containers with Docker, you have the option to run them in the background, also known as detached mode. This allows containers to run independently of your current terminal session, freeing up your terminal for other tasks.
To run a container in the background, you can use the -d or --detach flag with the docker run command.
Let's run another nginx container:
$ docker run -d --name my-nginx-2 nginx
310f1c48e402648ce4db41817dd76027d4528e481b25e985296fccc83421ddcb
When a container is running in the background, Docker assigns a unique container ID and displays it as output. You can use this ID to reference and manage the container later.
To view the list of running containers, you can use the docker ps command.
This command lists all the running containers along with their respective container IDs, names, and other information.
Since my-nginx-2 is running in the background, the docker logs command can help you to view the logs generated by a running Docker container.
It allows you to retrieve and display the standard output (stdout) and standard error (stderr) logs generated by the container's processes.
$ docker logs my-nginx-2
/docker-entrypoint.sh: /docker-entrypoint.d/ is not empty, will attempt to perform configuration
/docker-entrypoint.sh: Looking for shell scripts in /docker-entrypoint.d/
....
If you want a real-time view, add the -f (--follow) flag.
$ docker logs my-nginx-2 -f
...The docker container stop command is used to stop one or more running containers in Docker.
It gracefully stops the containers by sending a SIGTERM signal to the main process running inside each container and then waits for a specified timeout (default is 10 seconds) before forcefully terminating them with a SIGKILL signal if needed.
docker container stop my-nginx-2The docker container kill command is used to forcefully terminate one or more running containers in Docker. It immediately sends a SIGKILL signal to the main process running inside each container, causing them to stop abruptly without any graceful shutdown.
Stopped or killed containers can be restarted using the docker container start command, which resumes their execution from the point where they were stopped or killed.
By default, when you run a container using the docker run command, the container doesn't expose any of its ports to the outside world.
To make a port available to services outside of Docker, or to Docker containers running on a different network, use the --publish or -p flag.
This creates a firewall rule in the container, mapping a container port to a port on the host machine to the outside world.
Here's an example:
docker run --name nginx3 -p 8080:80 nginx-p 8080:80 maps port 80 in the container to port 8080 in the host machine.
You can then access the nginx web server by opening a web browser and navigating to http://localhost:8080.
Explore the running nginx container logs, can you see a log indicating your request you've just performed from the web browser?
Try to run the container without the -p flag and check that the nginx container is not accessible.
When running a container using the docker run command, you can specify environment variables using the -e or --env flag.
For example:
docker run -d -e MY_VAR=my_value --name nginx4 nginxIn this exercise, you will deploy three containers:
- One running an availability agent that will monitor the availability of your NetflixMovieCatalog app.
- Another for Prometheus which collects availability monitoring results and stores them.
- And a third for Grafana which visualizes the availability results.
We'll use docker run commands to launch each container and guide you through accessing the system.
The goal is to monitor the availability of your NetflixMovieCatalog using a simple Python app, collect the availability result metrics by Prometheus, and visualize them in Grafana.
First, let's start the availability agent, which is based in the alonithuji/availability-agent:v0.0.1 image:
docker run -d --name availability-agent -e TARGET_HOST=http://your-host.com -p 8081:8081 alonithuji/availability-agent:v0.0.1While changing http://your-host.com to the domain/IP address of your NetflixMovieCatalog app.
--name: Assigns a name to the container.-e TARGET_HOST: Sets an environment variableTARGET_HOSTwhich specifies the URL to be monitored.-p 8081:8081: Maps port 8081 on the container to your host.-d: Runs the container in the background.
To check that the container is running successfully, perform:
curl http://localhost:8081/metricsIf everything was set up properly, the app is accessing the TARGET_HOST URL, and returns the latency took to access TARGET_HOST, or 0 if the host is not available, as follows:
-
When
TARGET_HOST=https://www.google.com:host_availability{host="https://www.google.com"} 0.7910683155059814 -
When
TARGET_HOST=https://not-real-host:host_availability{host="https://not-real-host"} 0.0
The printed format is fit to be read by Prometheus.
Now we want to collect the availability metrics by Prometheus, a system that collects metrics from various services and stores them in a time-series database.
In order to configure prometheus to scrape your availability agent container (or any other target), you have to create a file named prometheus.yml:
scrape_configs:
  - job_name: 'availability_monitor'
    scrape_interval: 5s           # Scrapes every 15 seconds
    scrape_timeout: 5s            # Timeout for each scrape request
    static_configs:
      - targets: ['<availability-agent-ip>:8081']
As can be seen, we'll configure Prometheus to scrape 1 target named availability_monitor, every 5 seconds.
The address of the target should be the IP address of your running availability agent container, you can inspect the container and find the IP:
docker inspect availability-agentNote
Why can't we use http://localhost:8081 as the address of your availability agent container?
Let's run the prometheus container by performing the following command from the same directory where your prometheus.yml was created on your host machine:
docker run -d --name prometheus -p 9090:9090 -v $(pwd)/prometheus.yml:/etc/prometheus/prometheus.yml prom/prometheus-p 9090:9090: Maps port 9090 on the container (Prometheus web UI) to port 9090 on your host.
-v: Mounts your prometheus configuration file ($(pwd)/prometheus.yml) into the container, where prometheus expect to find it (/etc/prometheus/prometheus.yml).
Great. Now prometheus collects and stores the availability metrics of your host.
Next, run Grafana, which will visualize the metrics stored in Prometheus.
docker run -d --name grafana -p 3000:3000 grafana/grafana-p 3000:3000: Maps port 3000 (Grafana web UI) from the container to your host.
Open your browser and visit http://localhost:3000. The default username and password are both admin.
- Set up Prometheus data source in Grafana:
- Log into Grafana.
- On the left panel, click Connections → Data sources → Add data source.
- Select Prometheus and enter the URL:
http://<prometheus-container-ip>:9090. - Click Save & Test.
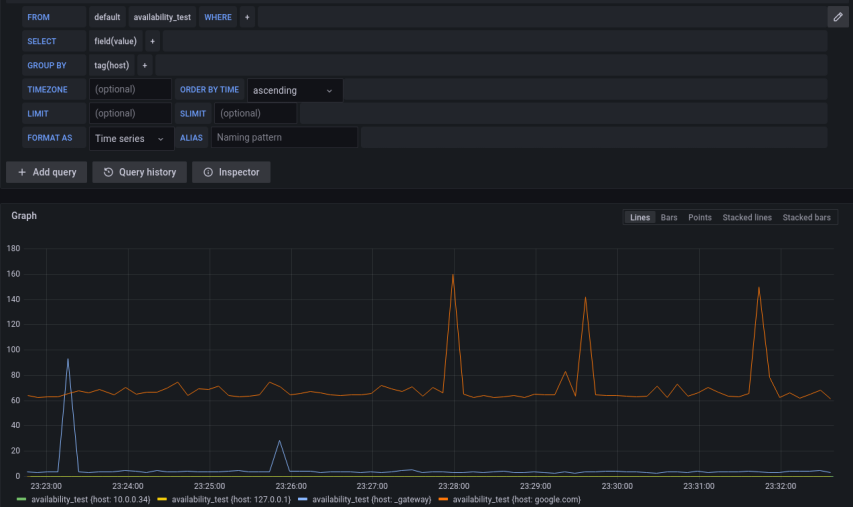
- On the left panel enter the Explore panel and try to get a graph of availability metrics over time.