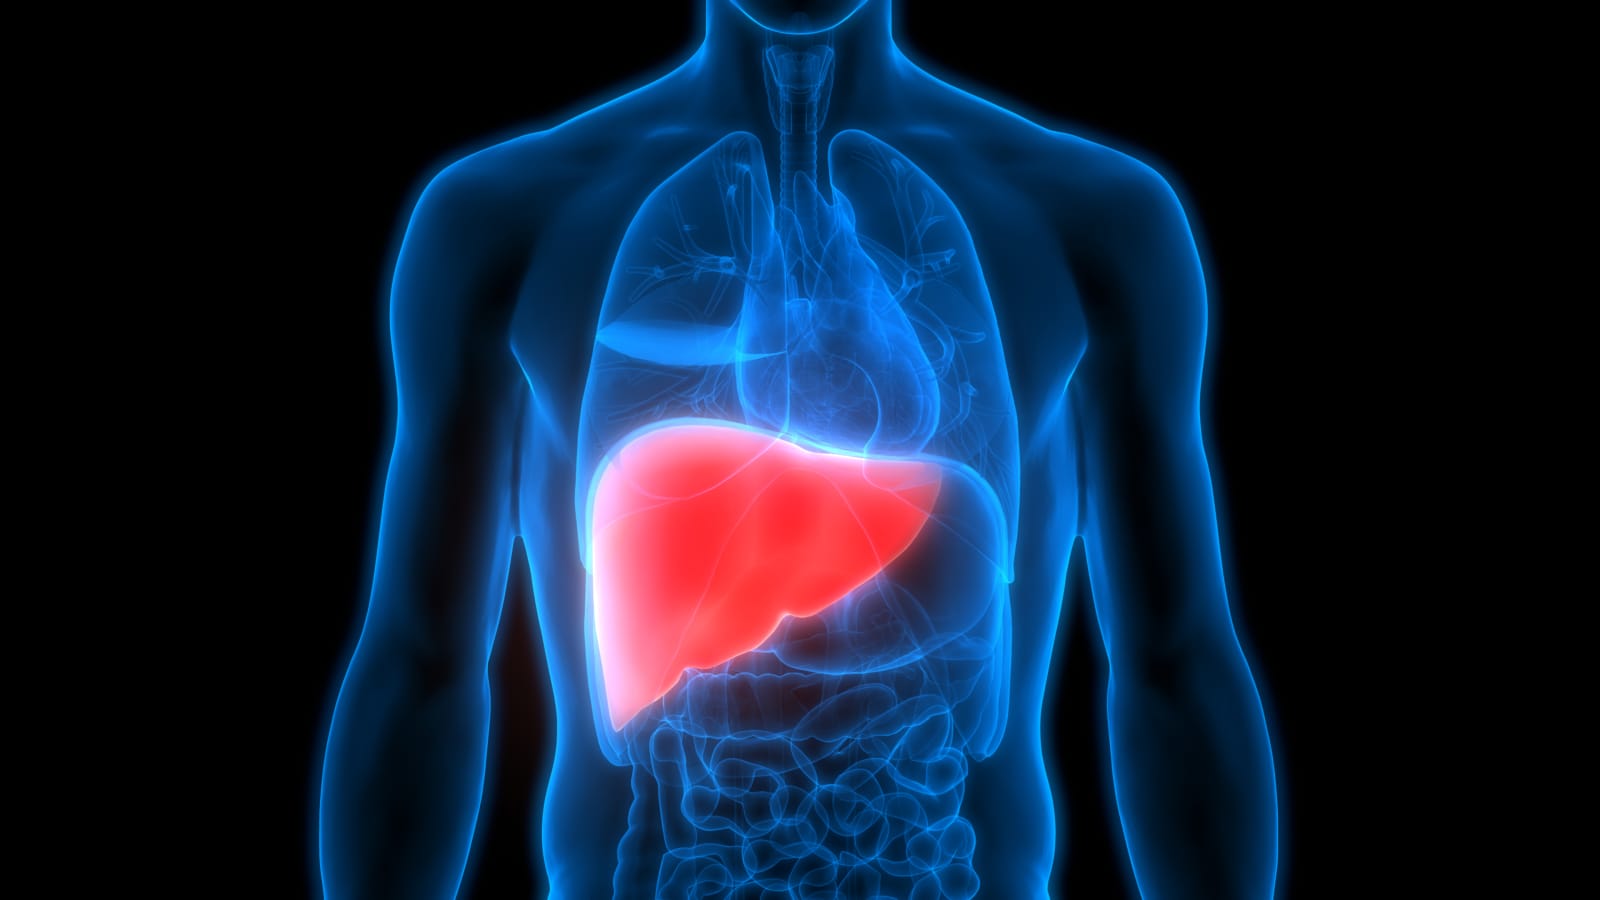
Liver cirrhosis is a widespread problem especially in North America due to high intake of alcohol. In this project, we will predict liver cirrhosis in a patient based on certain lifestyle and health conditions of a patient.
In liver cirrhosis, there are mainly 4 stages which are as follows:
- Stage 1 : Normal
- Stage 2 : Fatty Liver
- Stage 3 : Liver Fibrosis
- Stage 4 : Liver Cirrhosis
The primary target is to predict the stage of the liver cirrhosis disease. The dataset consists of both numerical as well as categorical features.
Link: https://cirrhosis-stage-prediction.herokuapp.com/
Cirrhosis is a late stage of scarring (fibrosis) of the liver caused by many forms of liver diseases and conditions, such as hepatitis and chronic alcoholism. The following data contains the information collected from the Mayo Clinic trial in primary biliary cirrhosis (PBC) of the liver conducted between 1974 and 1984. A description of the clinical background for the trial and the covariates recorded here is in Chapter 0, especially Section 0.2 of Fleming and Harrington, Counting Processes and Survival Analysis, Wiley, 1991. A more extended discussion can be found in Dickson, et al., Hepatology 10:1-7 (1989) and in Markus, et al., N Eng J of Med 320:1709-13 (1989).
A total of 424 PBC patients, referred to Mayo Clinic during that ten-year interval, met eligibility criteria for the randomized placebo-controlled trial of the drug D-penicillamine. The first 312 cases in the dataset participated in the randomized trial and contain largely complete data. The additional 112 cases did not participate in the clinical trial but consented to have basic measurements recorded and to be followed for survival. Six of those cases were lost to follow-up shortly after diagnosis, so the data here are on an additional 106 cases as well as the 312 randomized participants.
| Feature | Description |
|---|---|
| ID | Unique Identifier |
| N_Days | Number of days between registration and the earlier of death, transplantation, or study analysis time in July 1986 |
| Status | Status of the patient: C (censored), CL (censored due to liver tx), or D (death) |
| Drug | Type of drug: D-penicillamine or Placebo |
| Age | Age (in days) |
| Sex | M (Male) or F (Female) |
| Ascites | Presence of Ascites: N (No) or Y (Yes) |
| Hepatomegaly | Presence of Hepatomegaly: N (No) or Y (Yes) |
| Spiders | Presence of Spiders: N (No) or Y (Yes) |
| Edema | Presence of Edema: N (no edema and no diuretic therapy for edema), S (edema present without diuretics, or edema resolved by diuretics), or Y (edema despite diuretic therapy) |
| Bilirubin | Serum Bilirubin (in mg/dl) |
| Cholesterol | Serum Cholesterol (in mg/dl) |
| Albumin | Albumin (in gm/dl) |
| Copper | Urine Copper (in ug/day) |
| Alk_Phos | Alkaline Phosphatase (in U/liter) |
| SGOT | SGOT (in U/ml) |
| Triglycerides | Triglicerides (in mg/dl) |
| Platelets | Platelets per cubic (ml/1000) |
| Prothrombin | Prothrombin time in seconds (s) |
| Stage | Histologic Stage of Disease (1, 2, 3 or 4) |
The dataset can be found in appendix D of:
Fleming, T.R. and Harrington, D.P. (1991) Counting Processes and Survival Analysis. Wiley Series in Probability and Mathematical Statistics: Applied Probability and Statistics, John Wiley and Sons Inc., New York.


