How to Use
1. Start LogonTracer
2. Accessing the Web GUI
3. Login
4. Import EVTX
5. Search and visualize the event log
6. Importance rank of accounts and hosts
7. Timeline
Start LogonTracer by the following command option -r.
Use -h to see help message.
$ python3 logontracer.py -r -o [PORT] -u [USERNAME] -p [PASSWORD] -s [IP Address]- -r: Launch web server
- -o: Port number where the web server operates (ex: 8080)
- -u: Neo4j username (“neo4j” by default)
- -p: Neo4j password
- -s: Address where the web server operates (ex: localhost)
Access http://[LogonTracer_Server]:8080/ via Web browser. Please make sure to enable JavaScript on your browser.
Supported browsers
- Mozilla Firefox
- Google Chrome
- Microsoft Edge
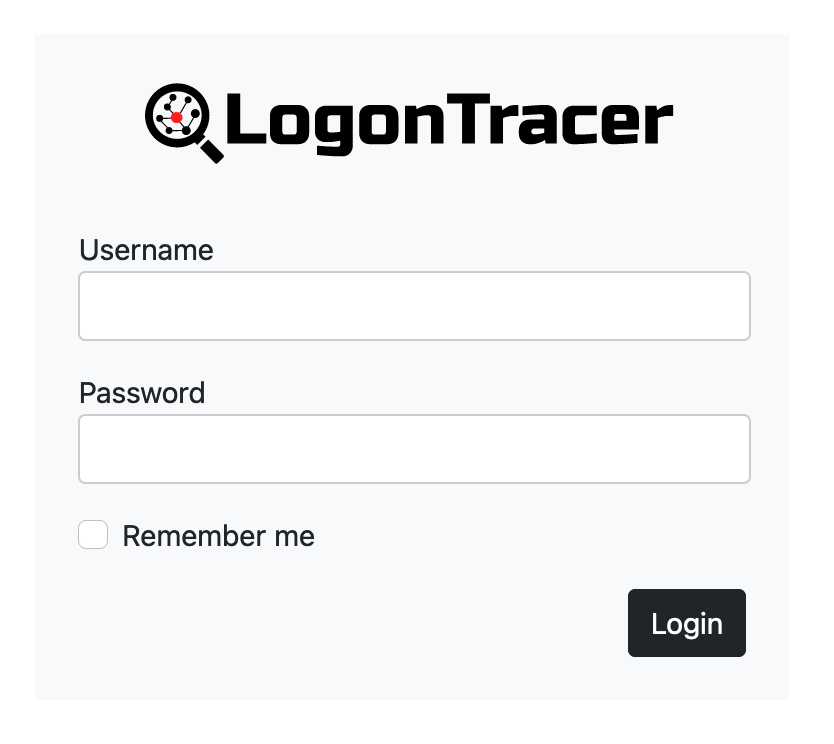
Login with the default account (neo4j) from the Web GUI. The password you use to login is the one you set in Neo4j.
Import the event log using Web GUI or logontracer.py. After importing EVTX, you need to reload the web page.
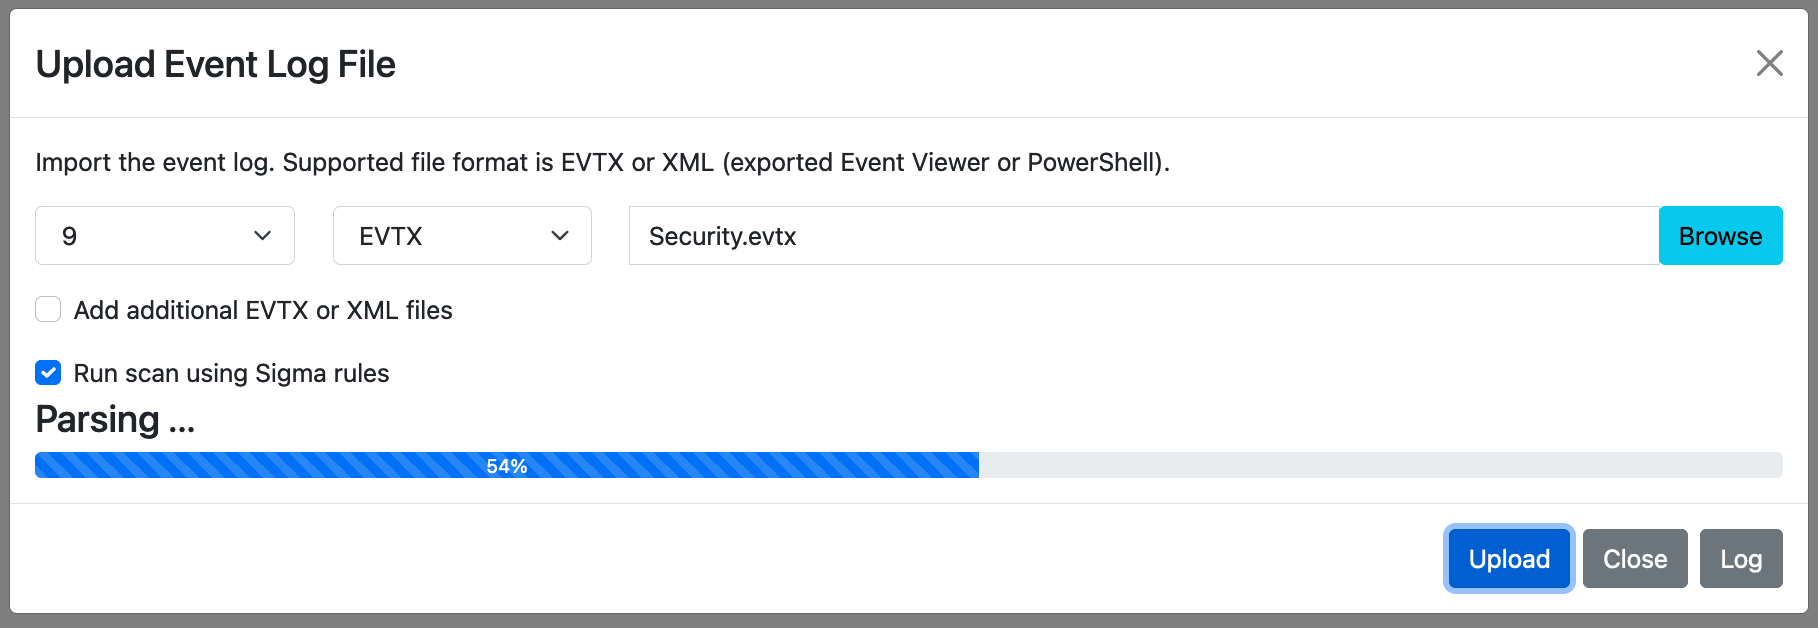
Event log can be imported with upload EVTX button. Supported file format is EVTX or XML(exported Event Viewer). If the import of the EVTX file is not successful, please check the "Log" button.
To add a log, enable "Add additional EVTX or XML files".
Event log can be imported by logontracer.py option -e or -x.
$ python3 logontracer.py -e [EVTX File] -z [TIME Zone] -u [USERNAME] -p [PASSWORD] -s [IP Address]or
$ python3 logontracer.py -x [XML File] -z [TIME Zone] -u [USERNAME] -p [PASSWORD] -s [IP Address]- -e: EVTX filename to import
- -x: XML filename to import
- -z: Time zone (ex: +9, -5)
When successfuly imported, you will get messages like below.
$ python3 logontracer.py -e Security.evtx -z +9 -u neo4j -p password -s localhost
[+] Script start. 2022/11/17 10:17:29
[+] Neo4j Kernel 4.2.19 (Enterprise)
[+] Use database neo4j.
[+] Time zone is 9.
[+] Last record number is 1230539.
[+] Start parsing the EVTX file.
[+] Parse the EVTX file Security.evtx.
[+] Now loading 1230500 records.
[+] Load finished.
[+] Total Event log is 1230539.
[+] Filtered Event log is 20400.
[+] Create cache files.
[+] Calculate ChangeFinder.
[+] Calculate Hidden Markov Model.
[+] Calculate PageRank.
[+] Creating a graph data.
[+] Creation of a graph data finished.
[+] Script end. 2022/11/17 22:15:04Use the navigation bar to search for account name, host name, IP address, event id and event count. You can also download graph data of CSV, JPG, PNG and JSON by Export button.

- search: Visualization of search host name and account name.
- search path: Search for how exploit the administrator account from the account. (only one Username)
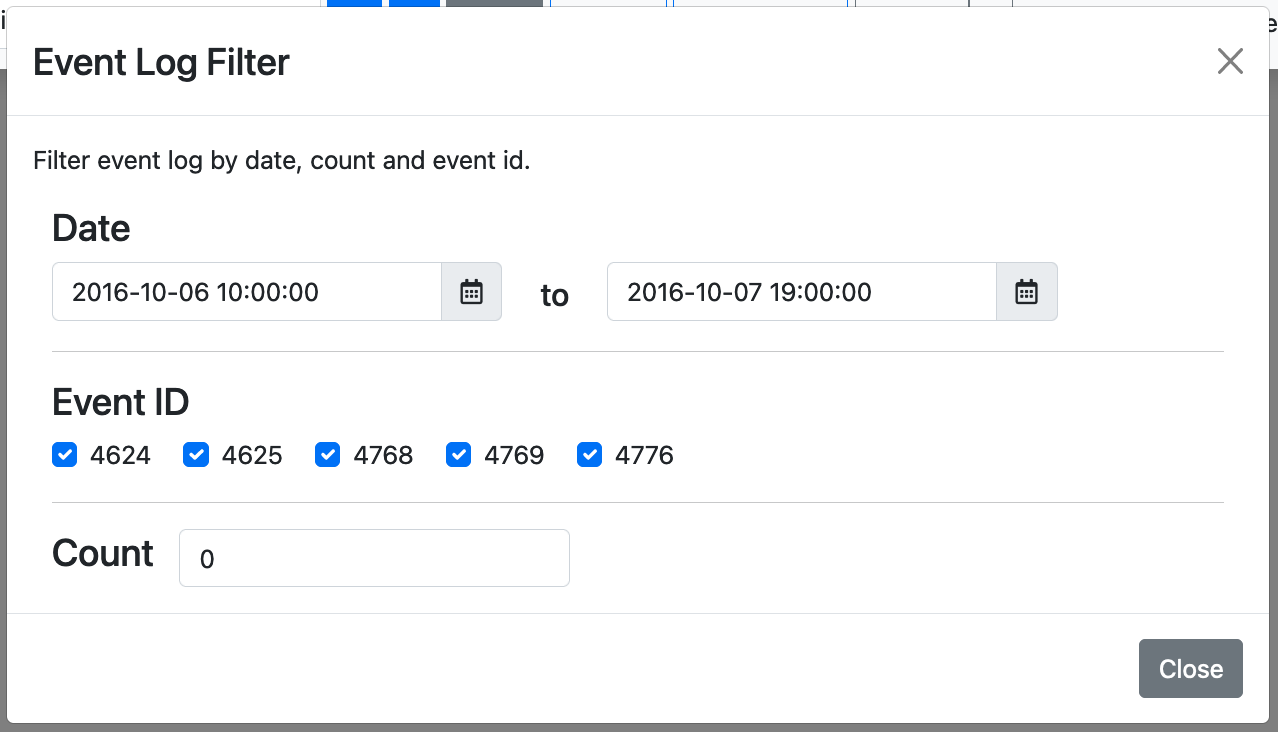
Also you could filter events with time range from filter panel.
Use drop-down menu to search for account names matching specific criteria.
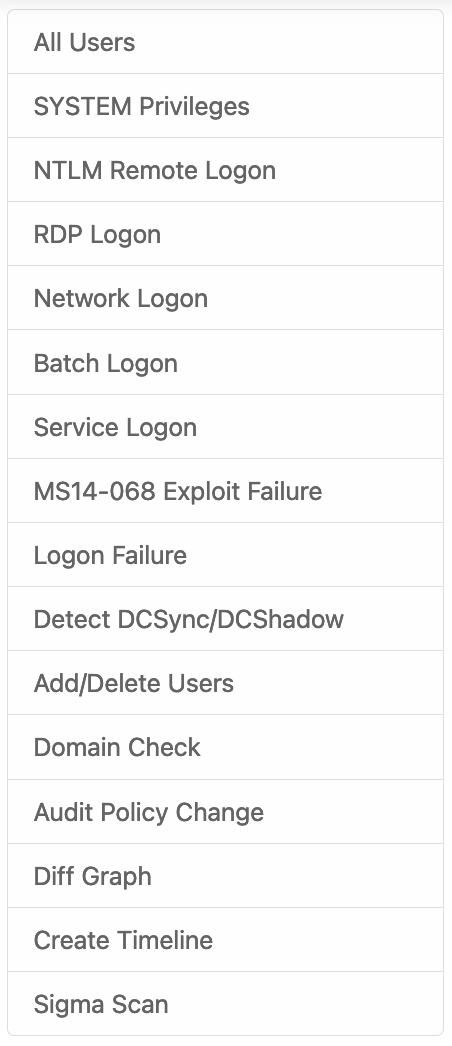
- All users: Visualizing all users and hosts.
- SYSTEM privileges: Visualizing users with system privileges.
- NTLM Remote Logon: Visualizing remote logon users and hosts using NTLM authentication. If not using NTLM authentication, it may be pass-the-hash.
- RDP Logon: Visualizing RDP logon users and hosts (Logon type: 10).
- Network Logon: Visualizing logon users and hosts from remote network (Logon type: 3).
- Batch Logon: Visualizing batch server logon (Logon type: 4).
- Service Logon: Visualizing Services Control Manager logon (Logon type: 5).
- ms14-068 exploit failure: Visualizing the error log that the ms14-068 exploit failed.
- Logon failure: Visualizing failed logon.
- Detect DCSync/DCShadow: Visualizing DCSync and DCShadow logs.
- Add/Delete Users: Visualizing deleted or added users.
- Domain Check: Visualizing all domain names. If an attacker is intrude into a network, there may be a malicious domain name.
- Audit Policy Change: Visualizing changed audit policy.
- Diff Graph: Compare specific two days and view the unique events.
- Sigma Scan: Event log search results using Sigma rules.
-
 SYSTEM privileges account
 -
 Standard user account
 -
 IP address and host
LogonTracer is able to provide leveraged accounts/hosts by ranking. LogonTracer performs network analysis and statistical analysis on the event log graph, and creates a ranking based on the “centrality” of each node. Centrality is an index which indicates each node’s proximity to the centre in a network. For calculation of centrality, PageRank is applied. PageRank is an algorithm for checking the importance of web pages. LogonTracer uses PageRank to examine the importance of accounts and hosts in a domain network. An account with high PageRank logs on to many hosts may be used by the attackers' lateral movement. Also, by analyzing the transition of event ID with Hidden Markov Model and checking accounts that make a transition different from usual such as Pass-the-Ticket, the accuracy of PageRank is improved.
![]()
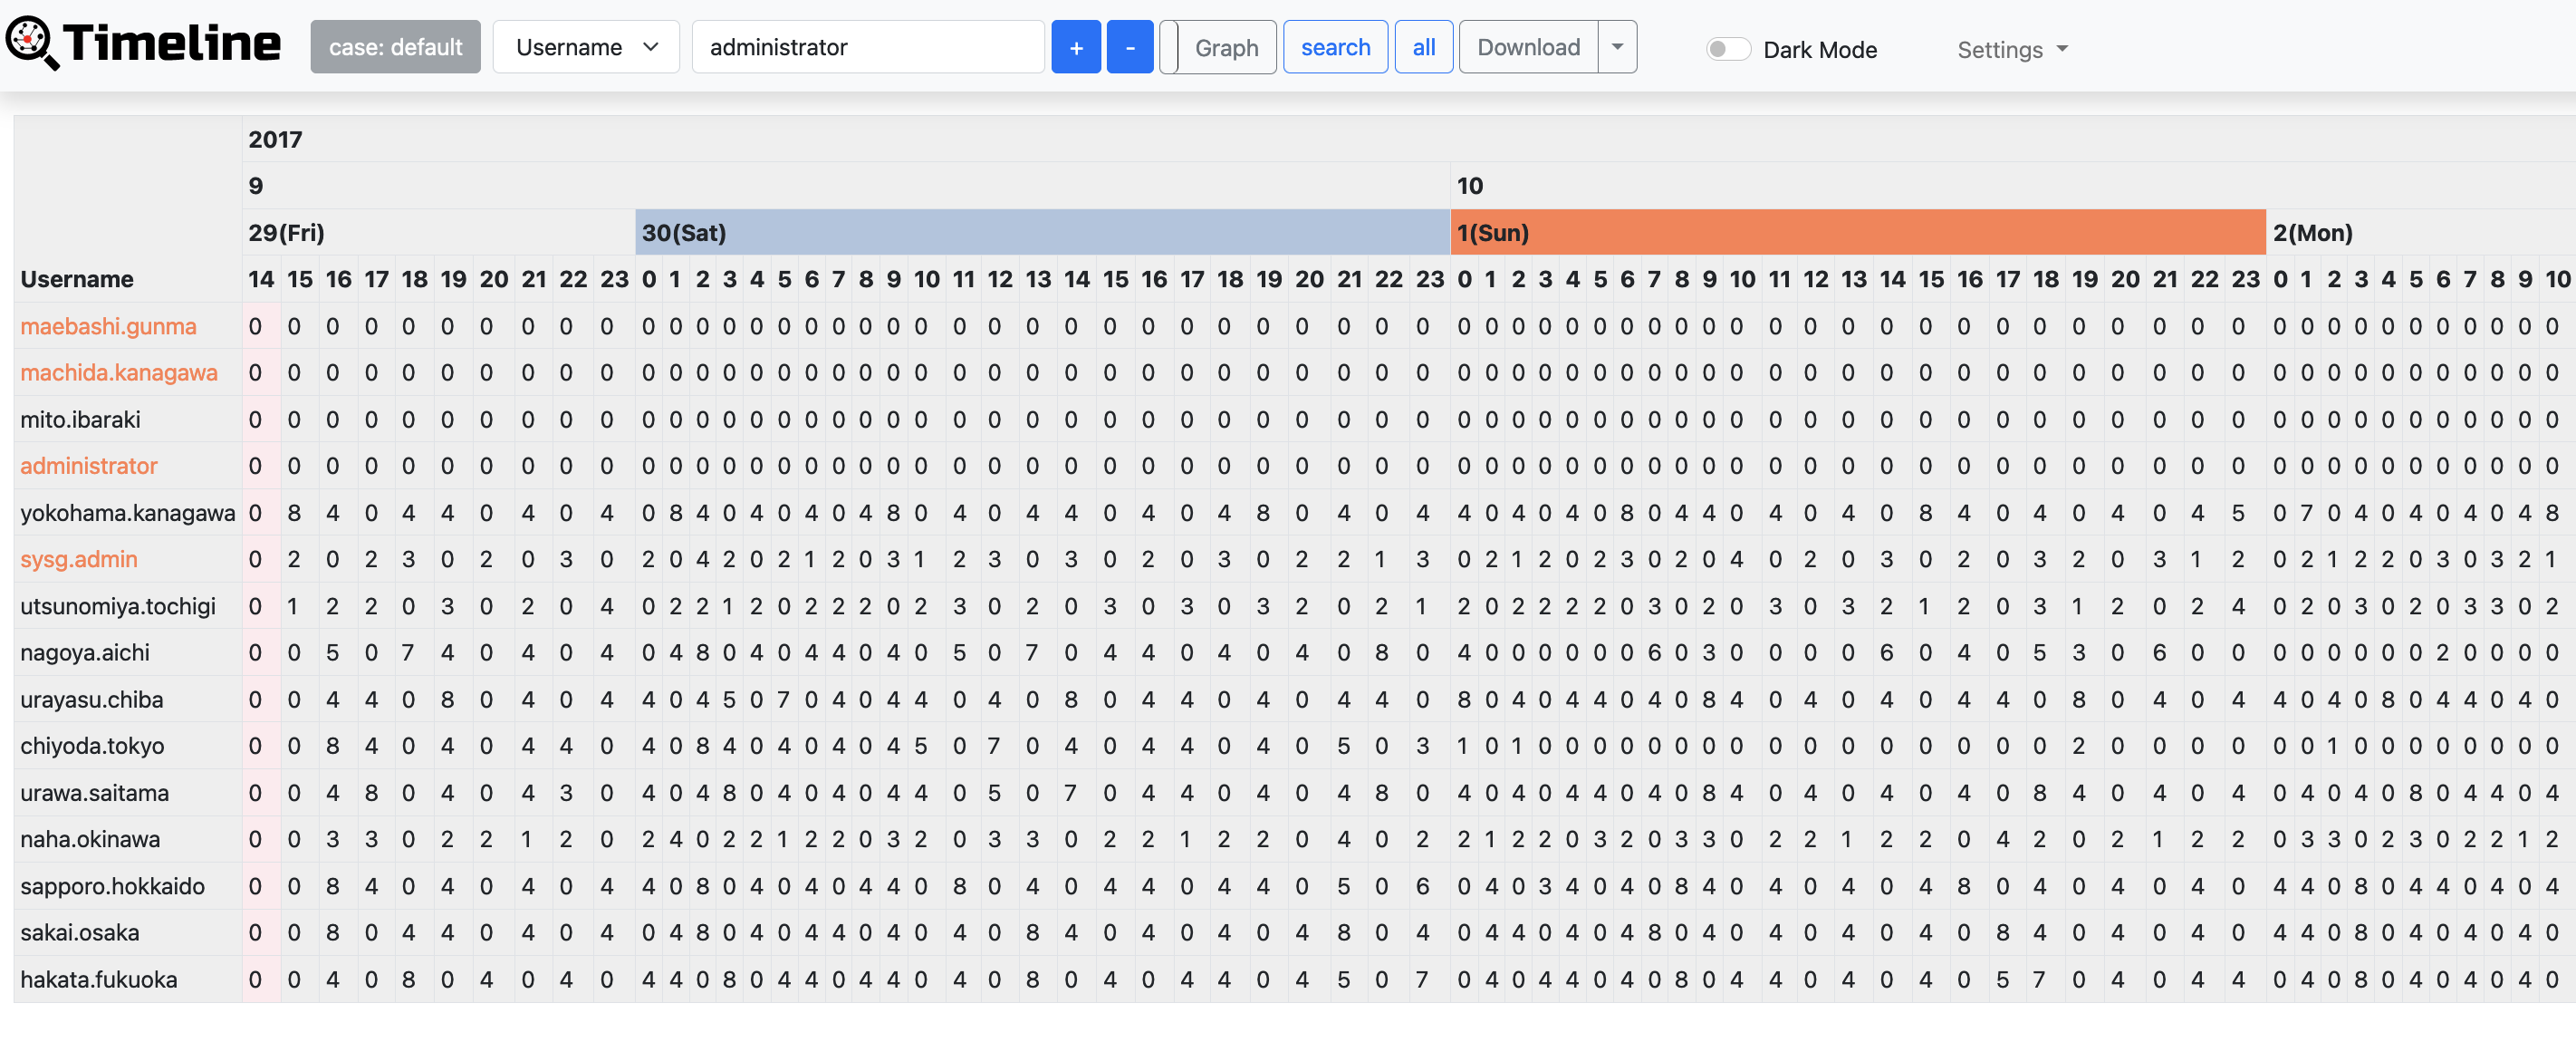
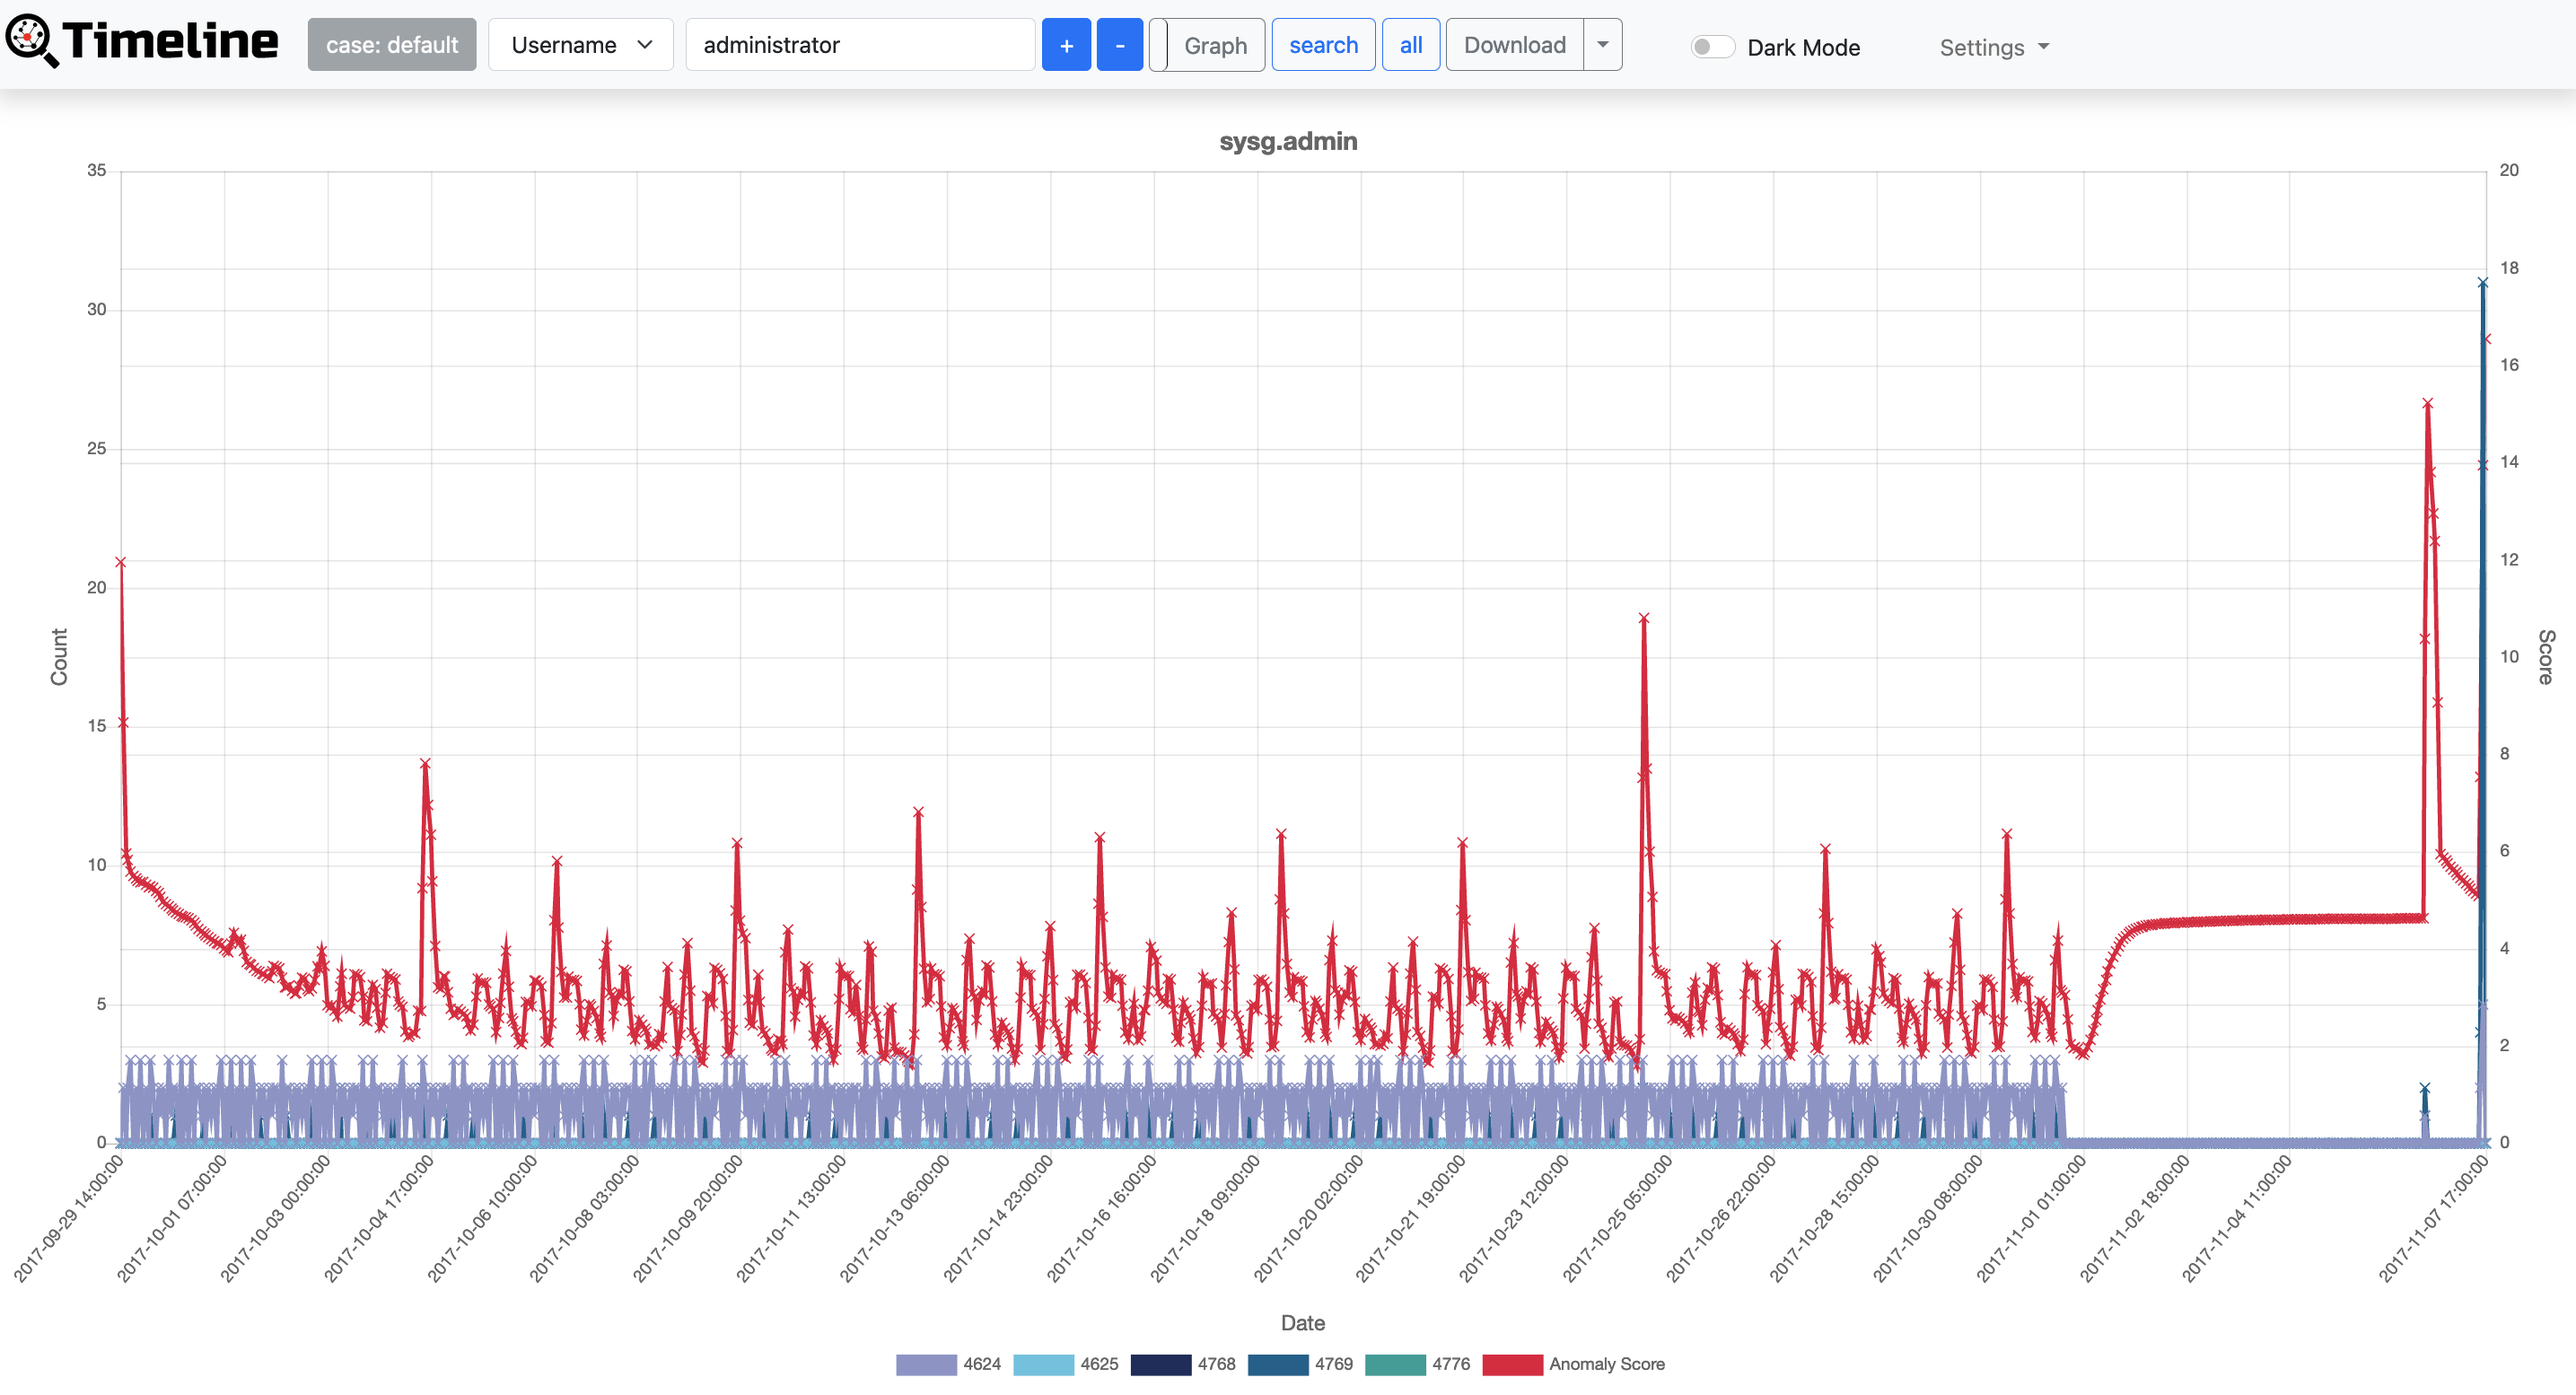
Timeline button displays hourly event log counts in time series. Timeline has two display formats, table and graph. Hosts with drastic changes are highlighted. For detecting the increase of the count, Change Finder is applied as an anomaly detection method. To download timeline summary and detailed CSV data, click "Download".