ChartForgeX renders polished charts, visual blocks, topology diagrams, and static report visuals from .NET without adding runtime chart dependencies to generated output.
The core package renders SVG, script-free static HTML, PNG, GIF, JPEG, BMP, PPM, and TIFF. Optional browser behavior lives in adapter packages, so generated reports can stay static while dashboard hosts can opt into tooltips, selection, zoom, pan, synchronized charts, and export controls.
dotnet add package ChartForgeXChartForgeX targets net472, netstandard2.0, net8.0, and net10.0. The core package has no runtime package dependencies.
| Package | Purpose |
|---|---|
ChartForgeX |
Static SVG, HTML, PNG, GIF, JPEG, BMP, PPM, and TIFF rendering. |
ChartForgeX.Interactivity |
Host-neutral interaction contracts. |
ChartForgeX.Interactivity.Html |
Self-contained HTML/SVG interaction adapter. |
These previews are generated by ChartForgeX.Examples and checked into the public repository. HTML links open through the Evotec preview service so the generated pages render directly.
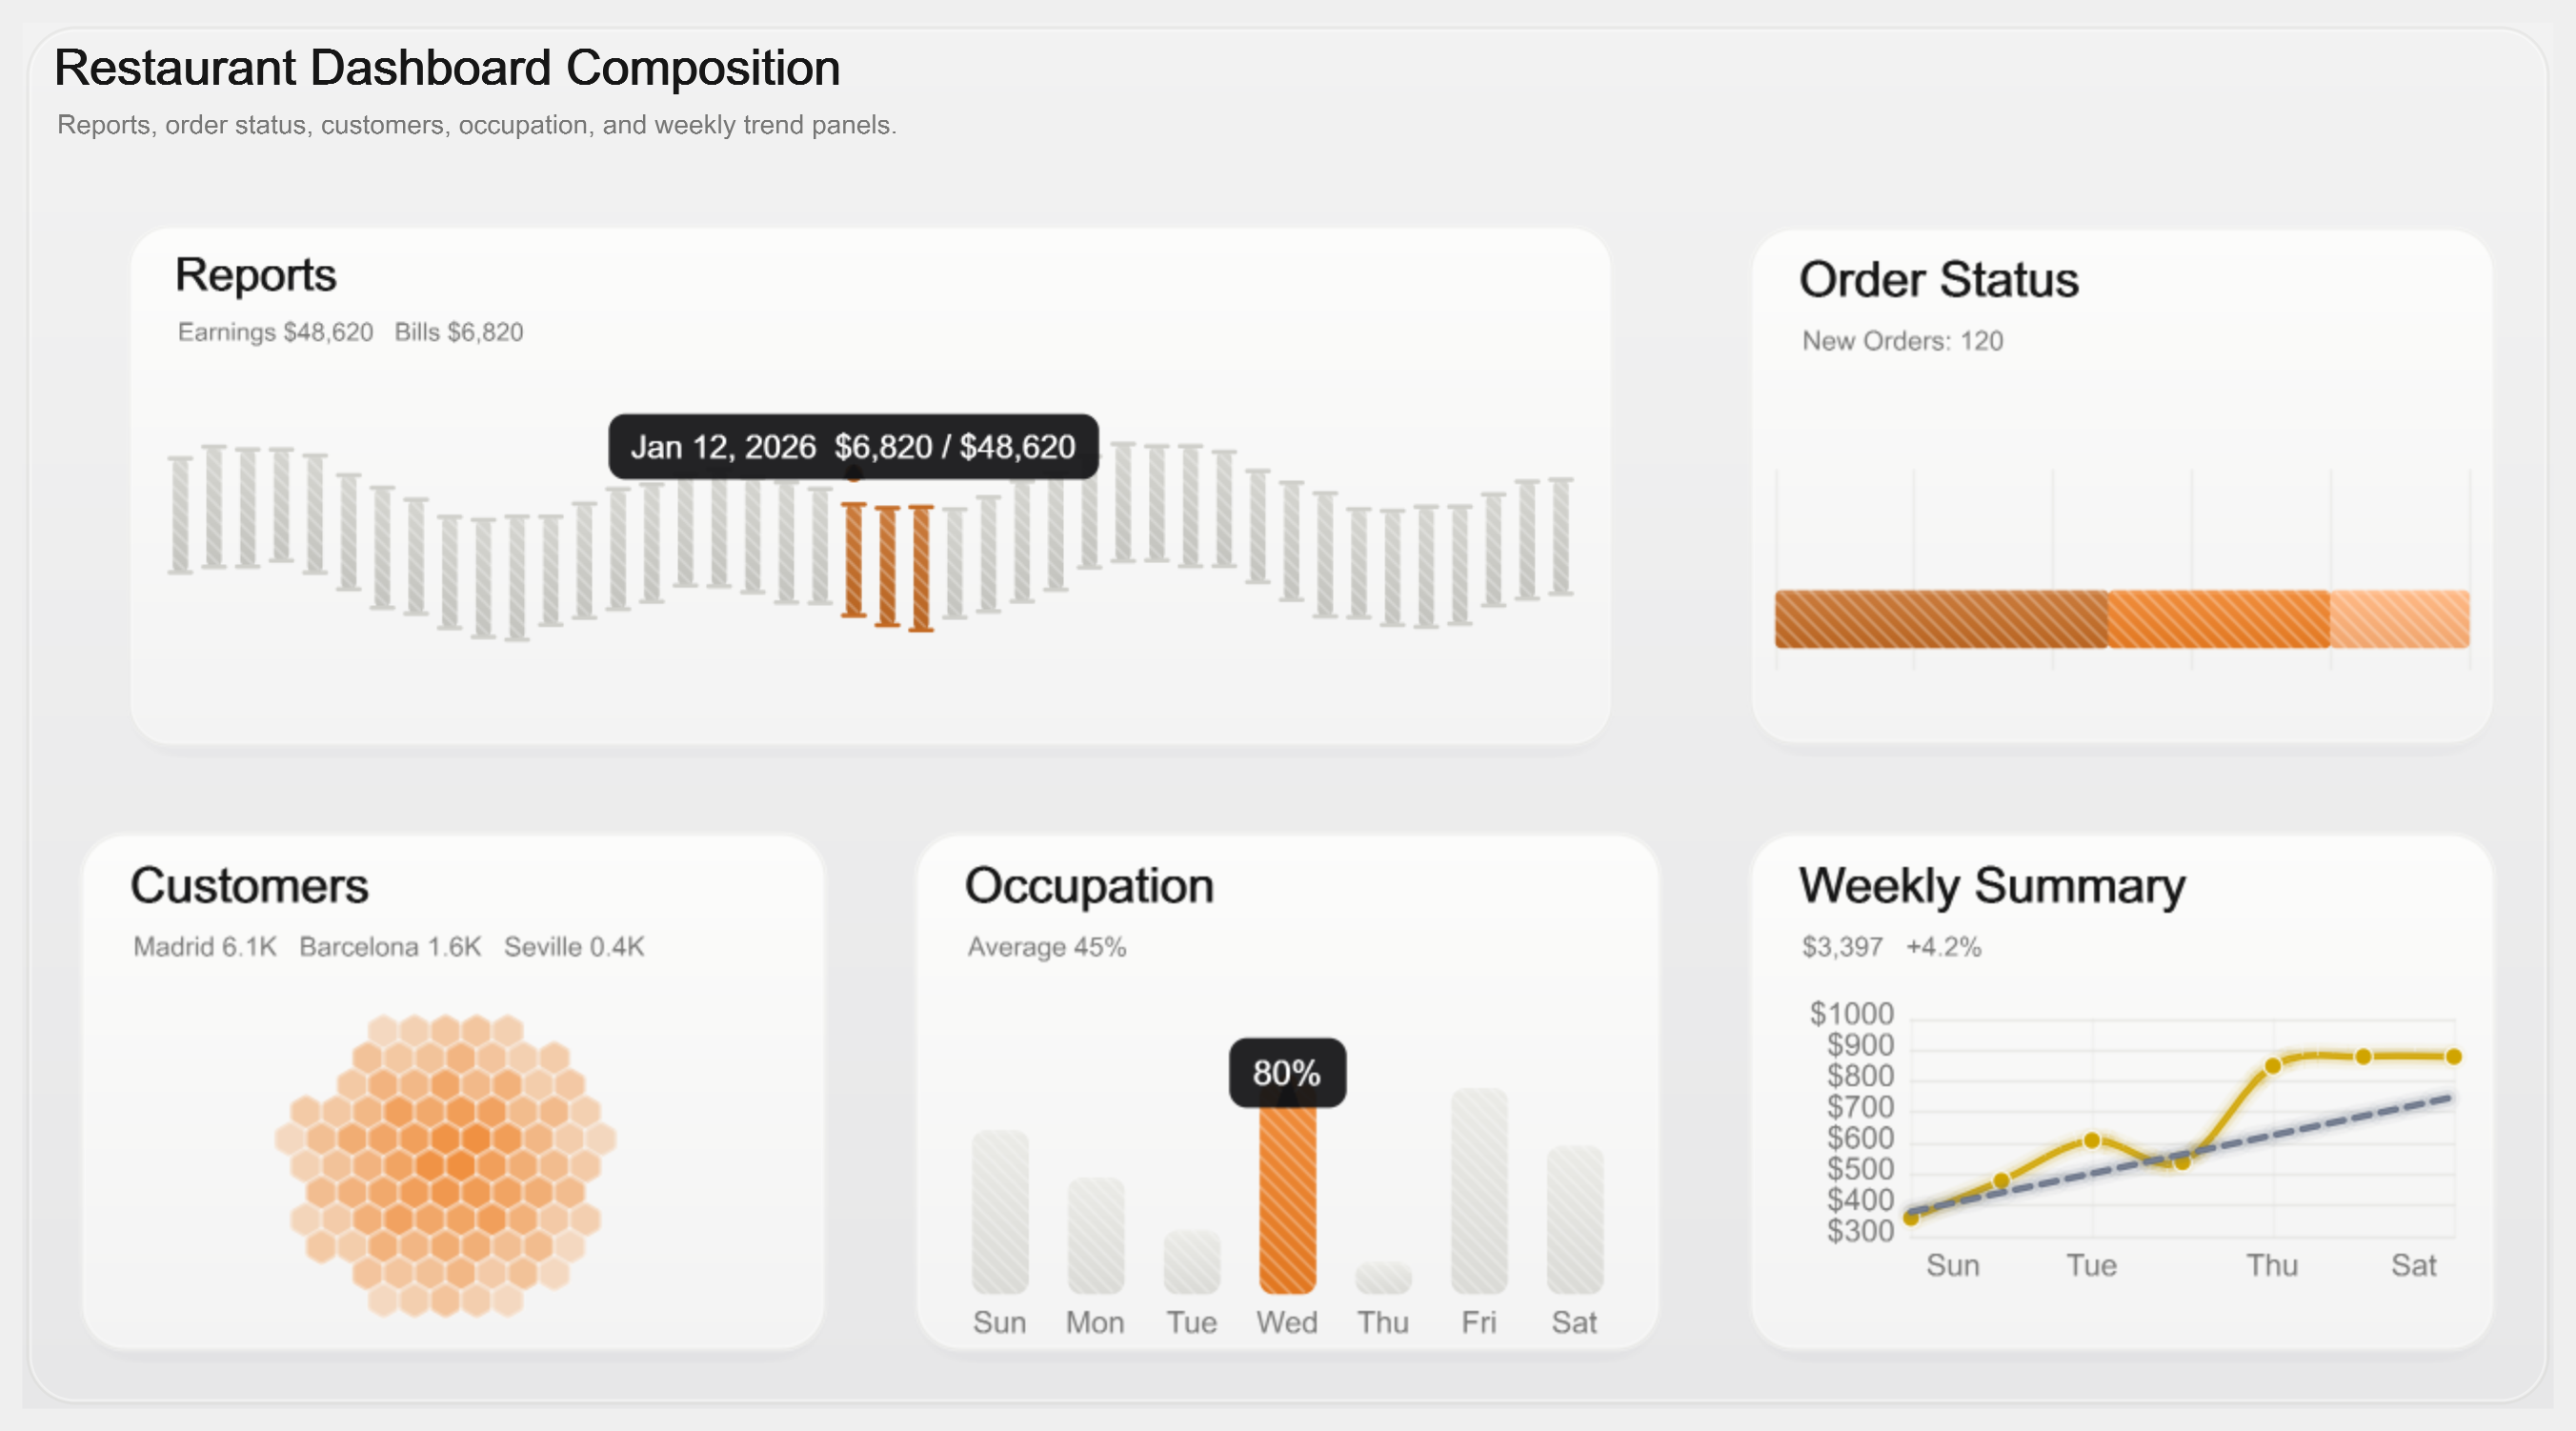
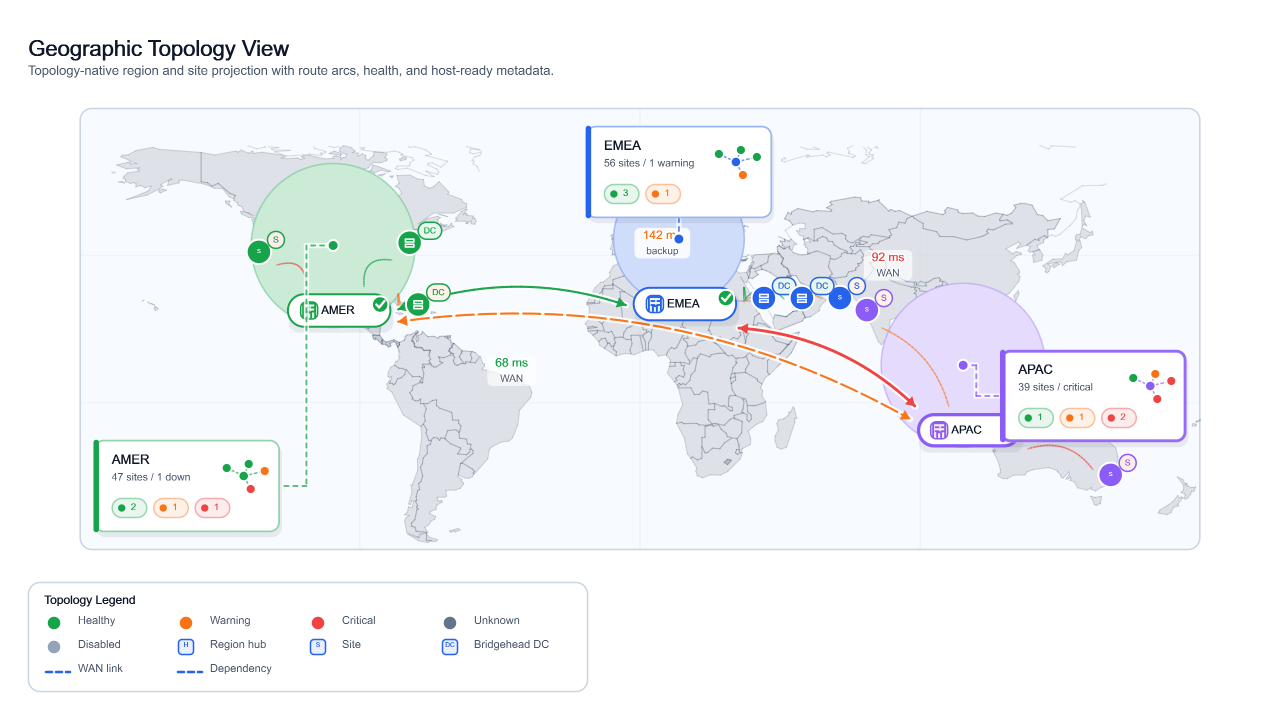
| Dashboard composition | Topology and geography |
|---|---|
 |
 |
| HTML / SVG / PNG | HTML / SVG / PNG |
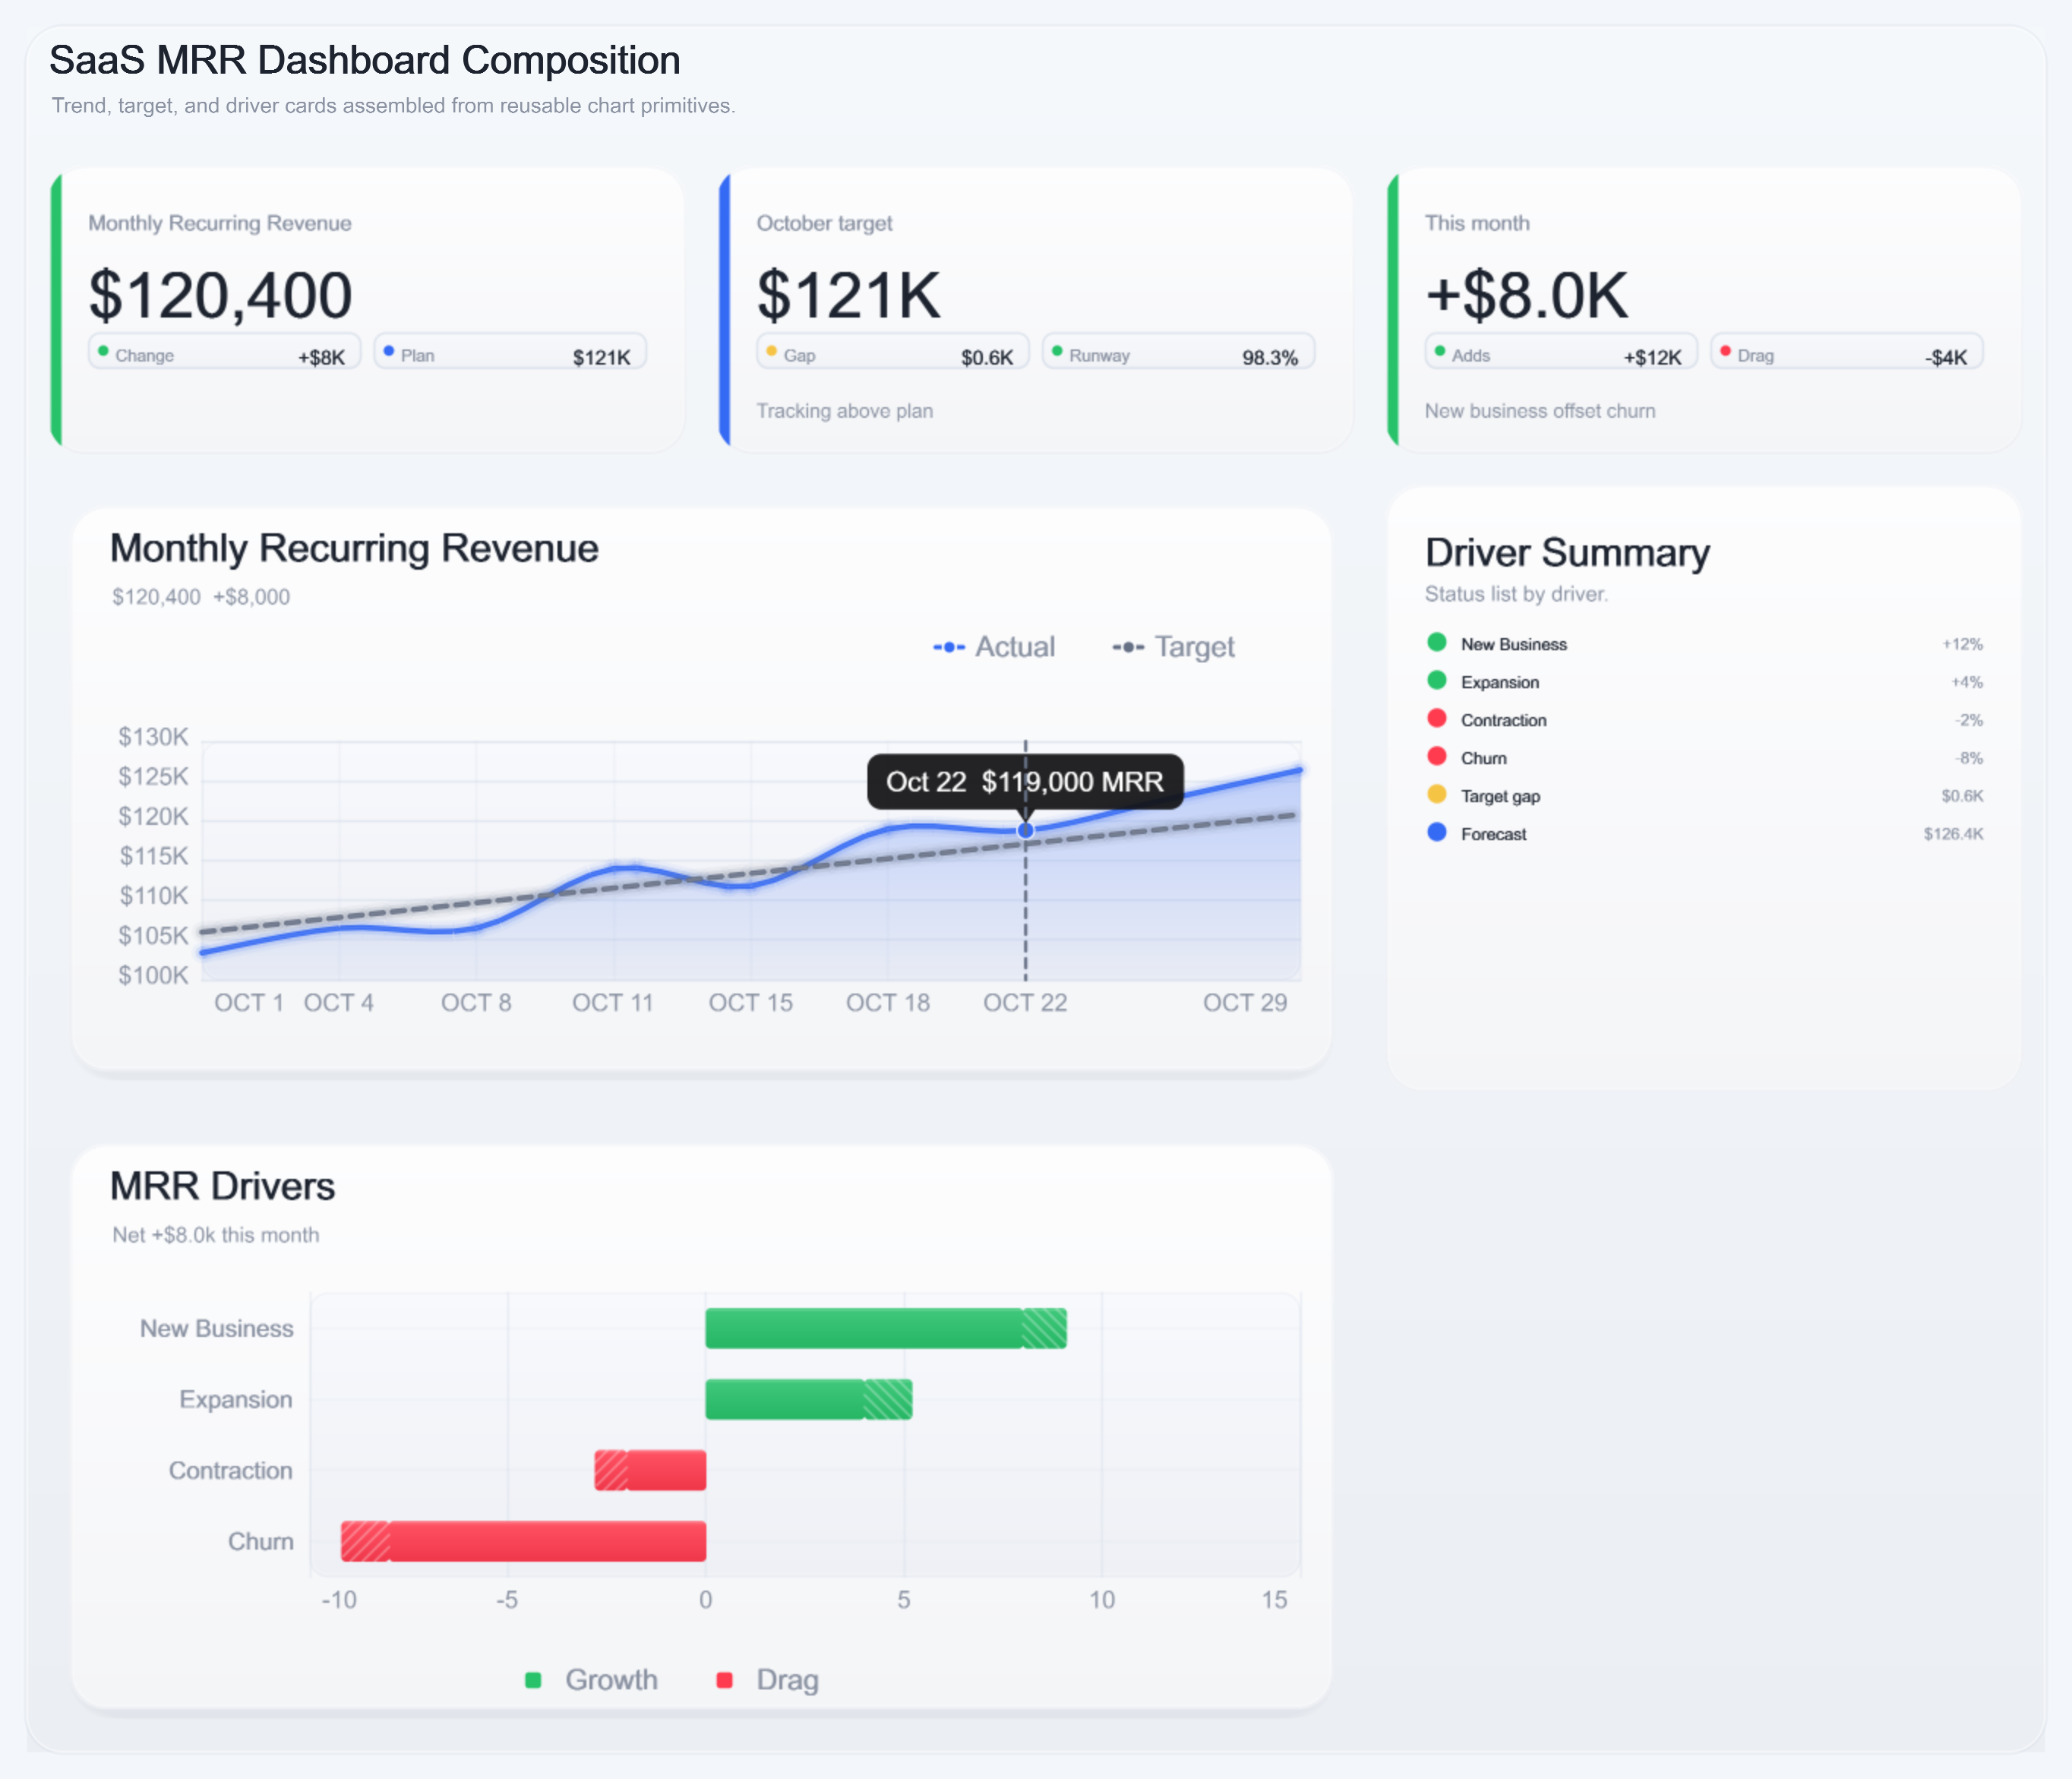
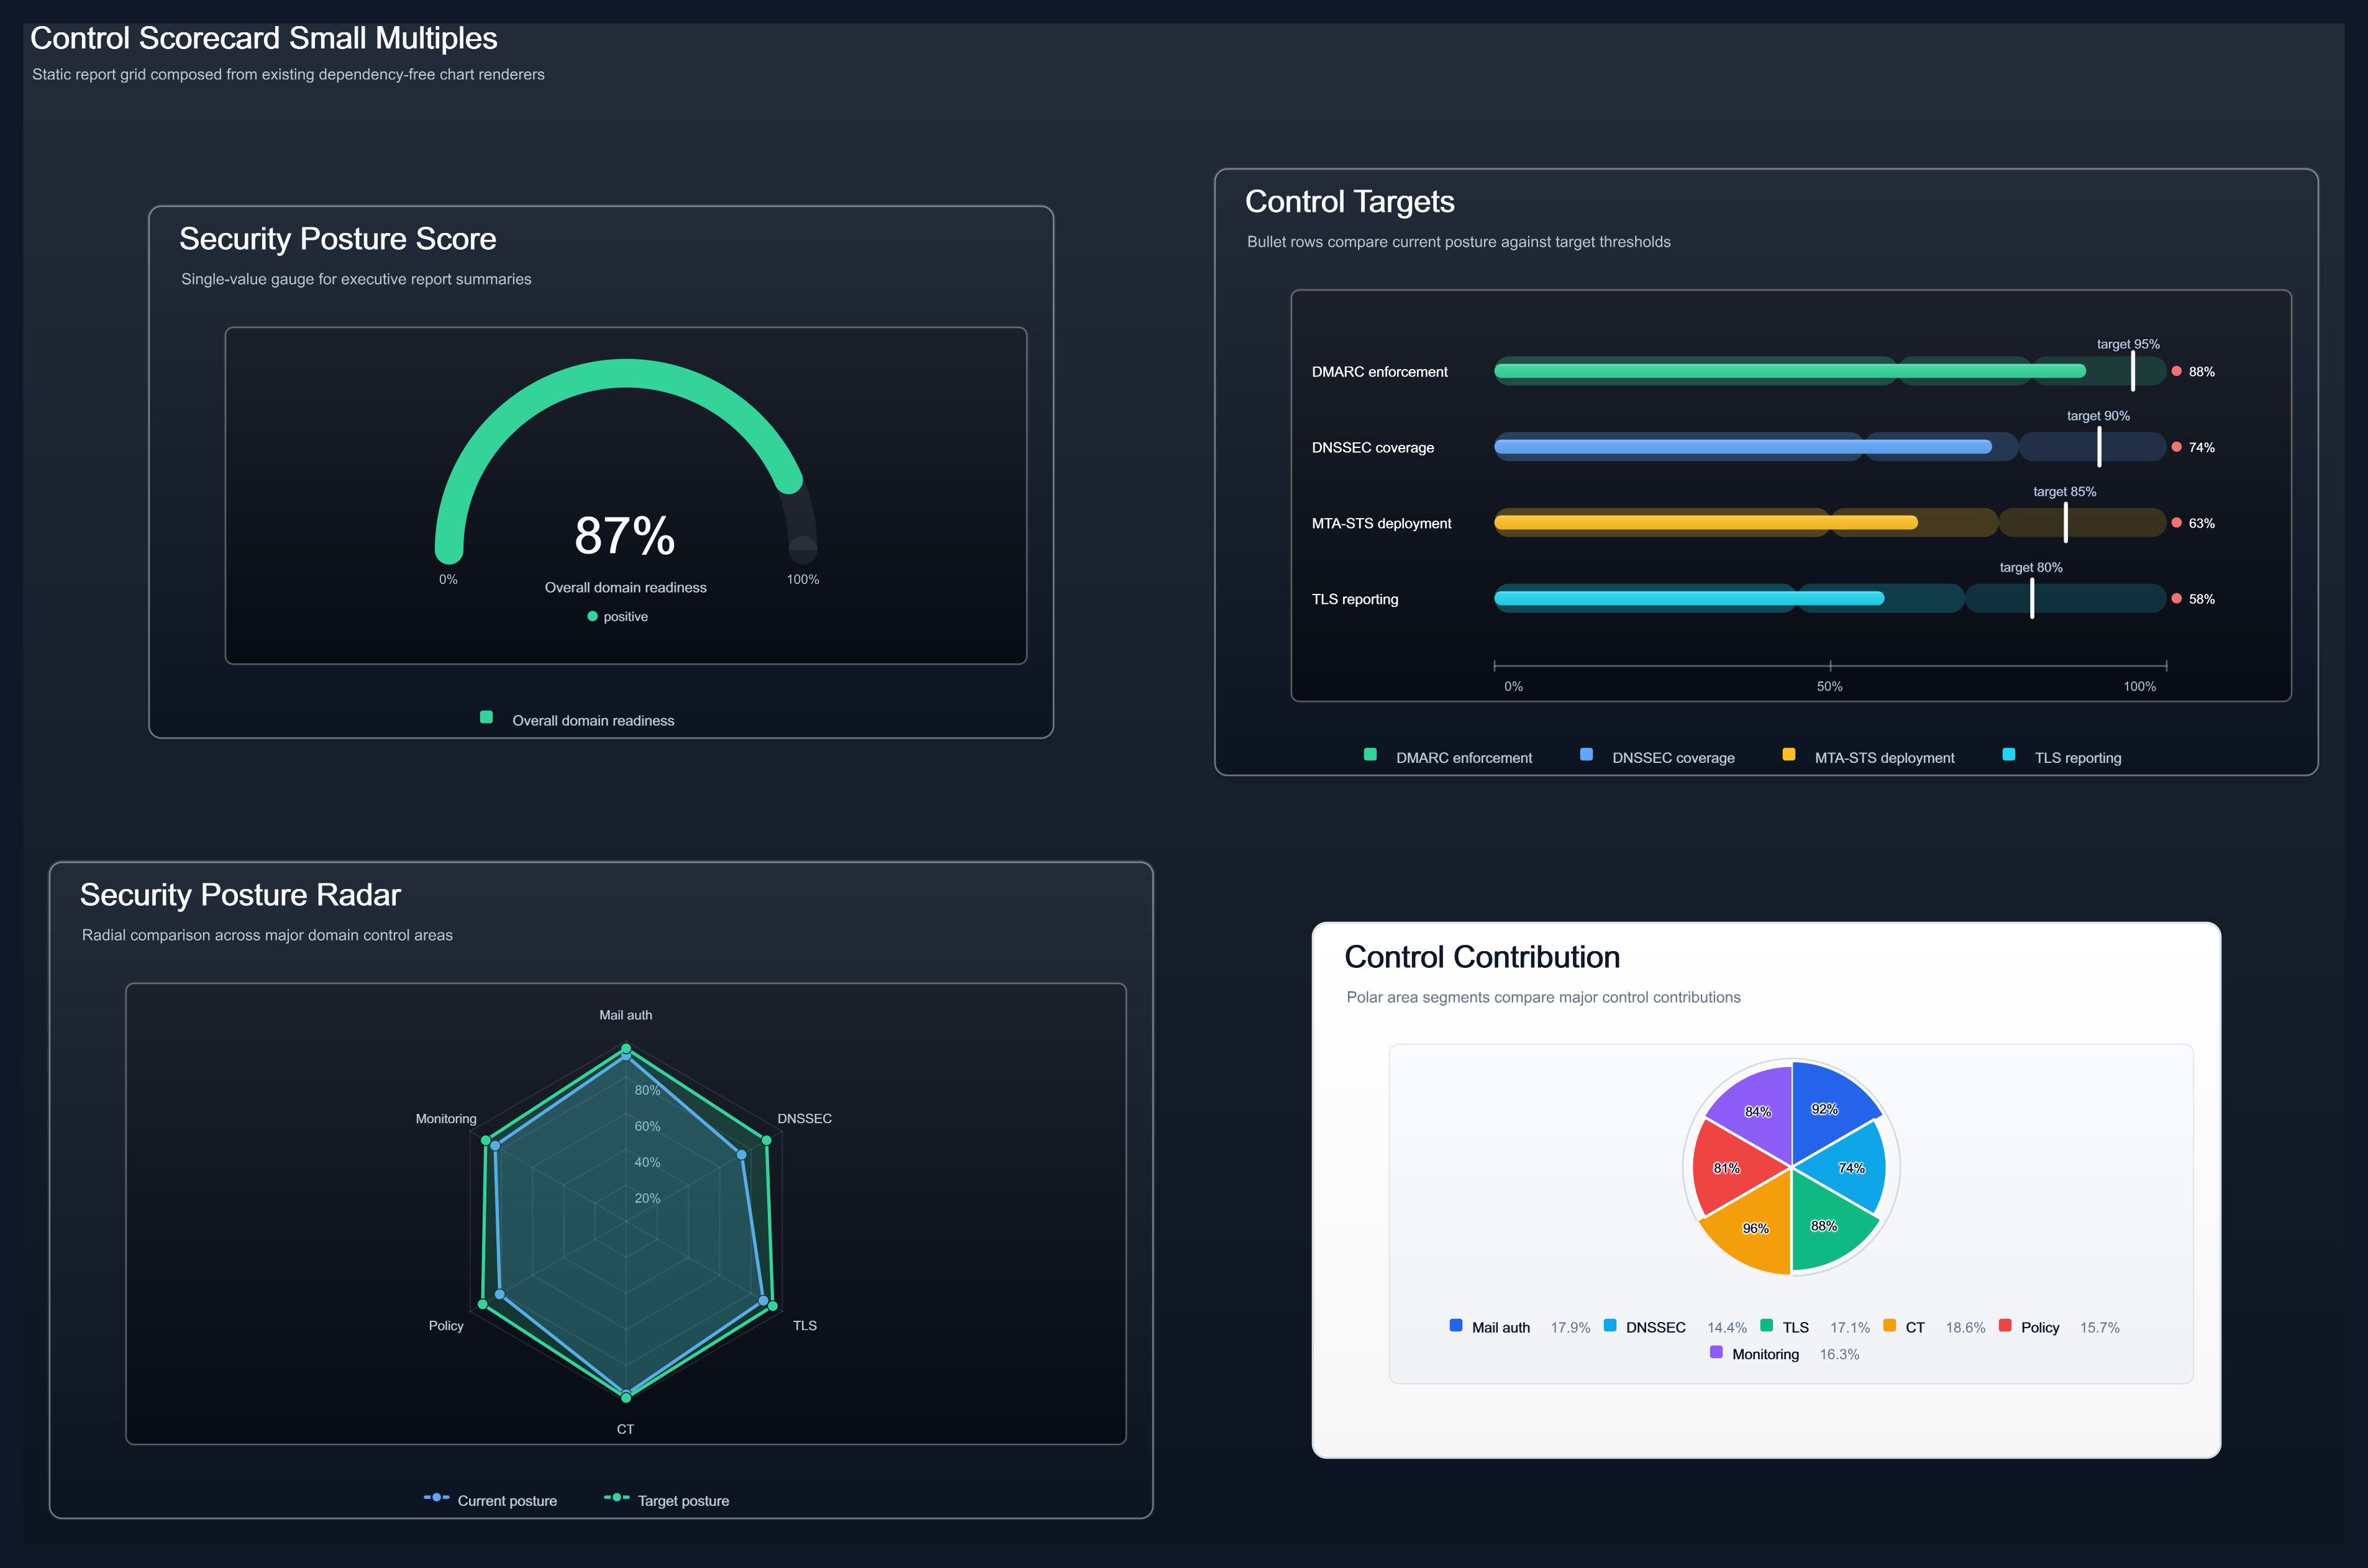
| Operational dashboard grids | Report-ready small multiples |
|---|---|
 |
 |
| HTML / SVG / PNG | HTML / SVG / PNG |
More generated output is available in the GitHub gallery artifacts and on the project site.
using ChartForgeX;
using ChartForgeX.Core;
using ChartForgeX.Primitives;
using ChartForgeX.Themes;
using System.Linq;

var chart = Chart.Create()
    .WithTitle("Domain Security Checks")
    .WithSubtitle("Dependency-free SVG, HTML, and PNG chart rendering")
    .WithXAxis("Run")
    .WithYAxis("Checks")
    .WithTheme(ChartTheme.ReportDark())
    .WithSize(1180, 640)
    .WithXLabels("Mon", "Tue", "Wed", "Thu", "Fri", "Sat", "Sun")
    .AddSmoothArea("Passed", Points(820, 940, 980, 1040, 1120, 1180, 1230))
    .AddSmoothLine("Warnings", Points(120, 138, 132, 110, 98, 86, 72), ChartColor.FromRgb(251, 191, 36));

chart.SaveSvg("domain-security.svg");
chart.SavePng("domain-security.png");
chart.SaveHtml("domain-security.html");

static ChartPoint[] Points(params double[] values) =>
values.Select((value, index) => new ChartPoint(index, value)).ToArray();For hosts that collect chart inputs from scripts, configuration, or UI forms, ChartForgeX.Simple provides small deferred definition objects and turns them into native ChartForgeX.Core.Chart instances. Simple uses core enums, themes, shapes, render options, point helpers, and bubble helpers instead of mirroring them, so direct ChartForgeX callers can stay on the core API.
using ChartForgeX;
using ChartForgeX.Core;
using ChartForgeX.Primitives;
using ChartForgeX.Simple;

var chart = Charts.Build(
    new ChartDefinition[] {
        new ChartBar("CPU", new double[] { 32, 48, 61 }, ChartColor.FromHex("#2DD4BF")),
        new ChartBar("Memory", new double[] { 44, 58, 72 }, ChartColor.FromHex("#60A5FA"))
    },
    width: 640,
    height: 360,
    xTitle: "Sample",
    yTitle: "Percent",
    showGrid: true,
    options: new ChartRenderOptions {
        UseOverlay = true,
        ShowLegend = true,
        ShowDataLabels = true
    });

chart.SavePng("wallpaper-overlay.png");
chart.SaveSvg("wallpaper-overlay.svg");
UseOverlay applies the transparent composition preset: no card, no plot fill, no axes/grid by default, and a transparent PNG/SVG background. Individual options such as ShowLegend, ShowGrid, or ShowAxes can still be set explicitly after the preset.
When you do not need deferred host definitions, build directly with helpers such as ChartPoints.FromValues(...) and ChartBubbles.FromXYSize(...).
| Need | Use |
|---|---|
| SVG markup | chart.ToSvg() or chart.SaveSvg("chart.svg") |
| Static HTML | chart.ToHtmlFragment(), chart.ToHtmlPage(), or chart.SaveHtml("chart.html") |
| PNG bytes/file | chart.ToPng() or chart.SavePng("chart.png") |
| GIF, JPEG, and raster file output | chart.Save("chart.gif"), chart.Save("chart.jpg", rasterOptions), chart.SaveRasterImage("chart.tiff"), or ImageComposition.FromFile("wallpaper.jpg").Save("wallpaper-output.gif") |
| Reusable image composition | ImageComposition.TryFromBytes(bytes, out var composition), composition.StrokeRectangle(...), composition.DrawCallout(...), composition.Write(stream, RasterImageFormat.Png), or composition.Save(path, RasterImageFormat.Gif) |
| Extension-inferred file output | chart.Save("chart.svg"), chart.Save("chart.html"), chart.Save("chart.png"), chart.Save("chart.gif"), chart.Save("chart.jpg"), chart.Save("chart.tiff") |
RasterImageOptions controls JPEG quality, PNG compression level, and the flattening background for opaque formats.
- Repository: https://github.com/EvotecIT/ChartForgeX
- Documentation and examples: https://chartforgex.evotec.xyz/
- Issues: https://github.com/EvotecIT/ChartForgeX/issues